PDD Stock Gains 0.87%, Testing Support Level In Focus
On September 17, 2026: price 78.76 USD, trend downtrend, RSI 36.9, support 77.81, resistance 90.20. technical analysis of pdd stock. PDD Stock Gains — full…

PDD Holdings is trading near the lower end of its recent range, and that matters for international investors because the stock is sending a mixed message: price is stabilising, but the broader trend still points down. On Nasdaq, PDD last changed hands at 78.76 USD, up 0.87% on the day, yet still down 9.75% over one month, which tells you the latest bounce has not yet repaired the larger slide.
Trend & Price Action
The first signal comes from where the stock sits versus its moving averages. PDD is trading below its SMA20 at 83.18 and SMA50 at 85.40, with the market in a stated downtrend and the SMA20 slope at -2.37% over five days. In plain language, the short-term average is still pointing lower, which usually means recent weakness is more than a one-day dip; sellers have remained in control of the tape.
There is also no fresh moving-average crossover to suggest a trend reversal. That matters because traders often look for a “golden cross” or similar shift as a sign that momentum is changing hands. Here, the absence of a new cross means the stock has not yet earned a technical reset. As shown in the chart, price is also below the Bollinger middle band at 83.18, reinforcing that PDD is still trading beneath its recent equilibrium zone.
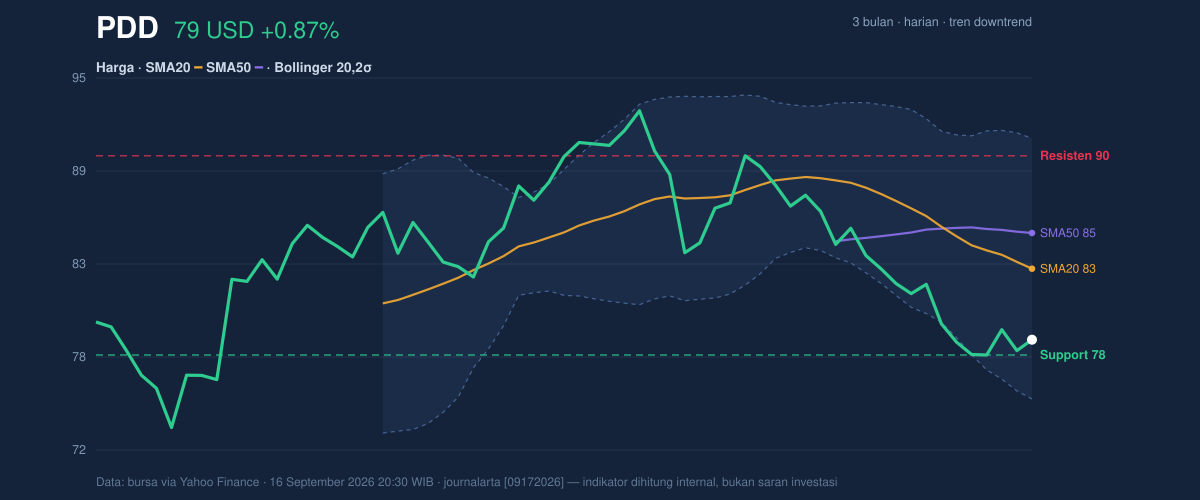
The range position is equally important. With support at 77.81 and resistance at 90.20, the stock is sitting only about 8% up from the lower end of that range. That placement is not a bullish breakout signal; it is a sign the market is testing whether buyers can defend the lower boundary before any broader recovery can develop. The stock’s 3-month high of 93.19 and 3-month low of 71.94 frame the bigger picture: PDD is closer to the bottom of that band than the top, but still not close enough to call the decline complete.
Oscillators & Momentum
Momentum is more nuanced than trend, and that is where the current setup becomes interesting. The RSI at 36.9 is described as neutral, which means the stock is not yet in a classic oversold panic zone, but it is close enough to suggest selling pressure has cooled. RSI is often read as a gauge of speed rather than direction: below 30 is usually oversold, above 70 overbought. PDD is not there, which argues against chasing a sharp rebound purely on momentum grounds.
The stochastics, however, are more stretched. With %K at 16.4 and %D at 14.4, the oscillator is in oversold territory, signalling that the stock has been under enough pressure to leave it vulnerable to a short-term bounce. That does not mean a reversal is guaranteed; it means downside momentum may be getting tired. The MACD at -2.270, still below its signal line at -1.731, keeps the broader momentum picture negative, and the histogram at -0.539 shows the bearish impulse remains intact, even if it is not accelerating.
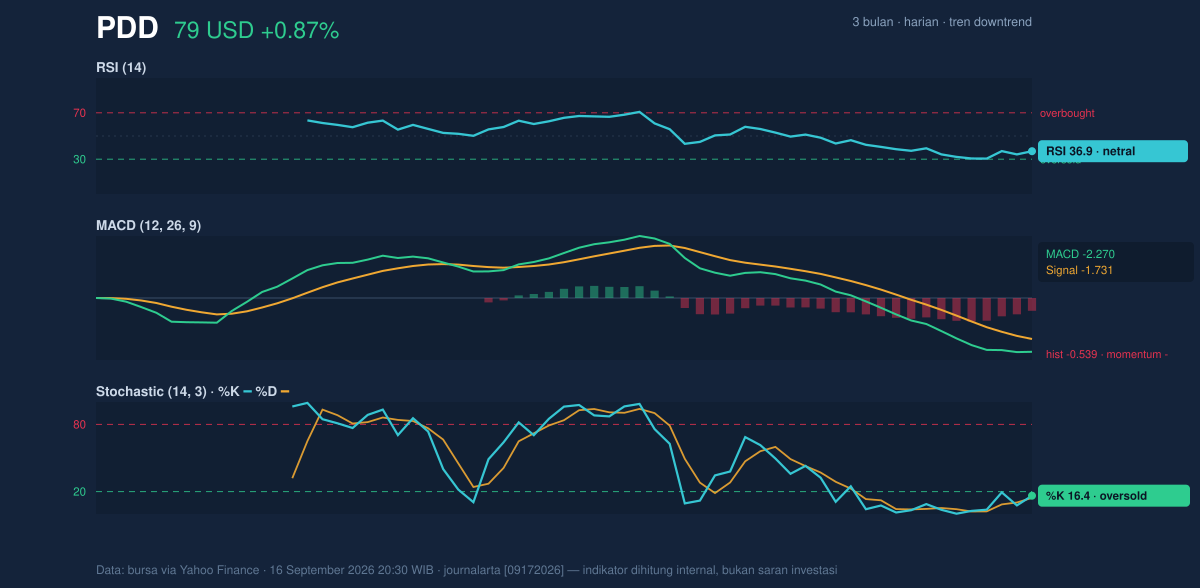
This combination is important. Oversold stochastics can flag a rebound window, but a negative MACD says the trend has not flipped. In practical terms, PDD looks like a stock that may be due for short-term mean reversion, while still lacking confirmation that the larger downtrend has ended.
Volatility & Volume
Volatility is present, but not extreme. The ATR(14) at 1.77, or 2.2% of price, suggests the stock is moving enough to matter day to day, but not in a disorderly fashion. Bollinger Bands add another layer: the lower band at 75.07, middle at 83.18, and upper at 91.28 show price sitting in the lower part of the envelope, with %B at 23%. That low %B reading means the stock is trading close to the lower band, often a sign of weakness, but also a zone where rebounds can emerge if selling pressure fades.
The Bollinger band width at 19.5% is described as normal, which matters because it implies there is no major squeeze or expansion signalling an explosive move is already underway. In other words, the chart is not compressed enough to promise a sudden breakout, and not stretched enough to suggest panic. Volume confirms the caution. Last volume was 6,573,700, below the 20-day average of 7,364,955, or 0.9x normal. That is a weak confirmation signal: price rose modestly, but participation was not strong enough to make the move look decisive. The OBV is falling, which means volume has been leaning toward distribution rather than accumulation.
Key Levels & Scenarios
The nearest technical line in the sand is the 77.81 support. If that level holds, the stock can continue to probe for a bounce from an already depressed part of its range. If it fails, the next reference is the 3-month low at 71.94, which would mark a deeper breakdown in the existing downtrend. On the upside, the first meaningful barrier is 83.18, the SMA20 and Bollinger middle band, because reclaiming it would show the stock has moved back into its short-term fair-value zone. Beyond that, 85.40 at the SMA50 and then 90.20 resistance would need to give way before the chart could look materially healthier.
Technical Verdict: HOLD (wait & see)
HOLD (wait & see)
- MACD remains negative, so the larger trend has not reversed.
- Stochastic is oversold, which supports a possible bounce, but not a confirmed trend change.
- Price is below SMA20 and SMA50, so the stock is still trading under both short- and medium-term averages.
Verdict invalidated if price falls below 77.81, because that would put the stock through its nearest support and reopen the path toward 71.94.
- Ideal entry range: 77.81 to 83.18
- Exit target: 85.40, then 90.20
- Stop loss protection: below 77.81
For non-traders: PDD looks like a stock that is still under pressure, but close enough to support that the next move may decide whether this is a pause or another leg lower.
“If 77.81 gives way, the chart stops being a bounce story and starts becoming a breakdown story.”
Summary Data PDD
| Last price | 78.76 USD |
| Change 1 day / 5 days / 1 month | 0.87% / 0.19% / -9.75% |
| Trend / MA-cross | downtrend / none |
| SMA20 / SMA50 | 83.18 / 85.40 |
| RSI (14) / Stochastic %K | 36.9 / 16.4 |
| Bollinger %B / ATR | 23% / 1.77 |
| Support / Resistance 20 days | 77.81 / 90.20 |
| Data as of | 16 September 2026 20:30 WIB |


