Momentum Weakens, XOM Stock Drops 3.54% Today
On September 17, 2026: price 163.32 USD, trend uptrend, RSI 53.3, support 156.44, resistance 169.32. technical analysis of xom stock. Momentum Weakens — full…

ExxonMobil fell to 163.32 USD on the NYSE on 16 September 2026, easing 3.54% from the previous close as the stock pulled back from a recent high, while still trading above its short- and medium-term trend markers. The move matters because it puts XOM in a narrow but important zone: the shares remain in an uptrend, yet the latest price action shows momentum is no longer fully aligned with that trend, which often happens when a stock pauses after a run rather than when a new downtrend has already taken hold.
Trend & Price Action
The chart shows XOM sitting above its SMA20 at 162.86 and well above its SMA50 at 156.82, which is a constructive structure for a stock that is still being carried by its intermediate trend. The SMA20 slope of 0.73% over 5 days points upward, so the short-term trend is still rising rather than flattening out. That said, there is no fresh MA-cross, meaning the market is not getting a new trend signal from moving averages; it is simply extending an existing one.
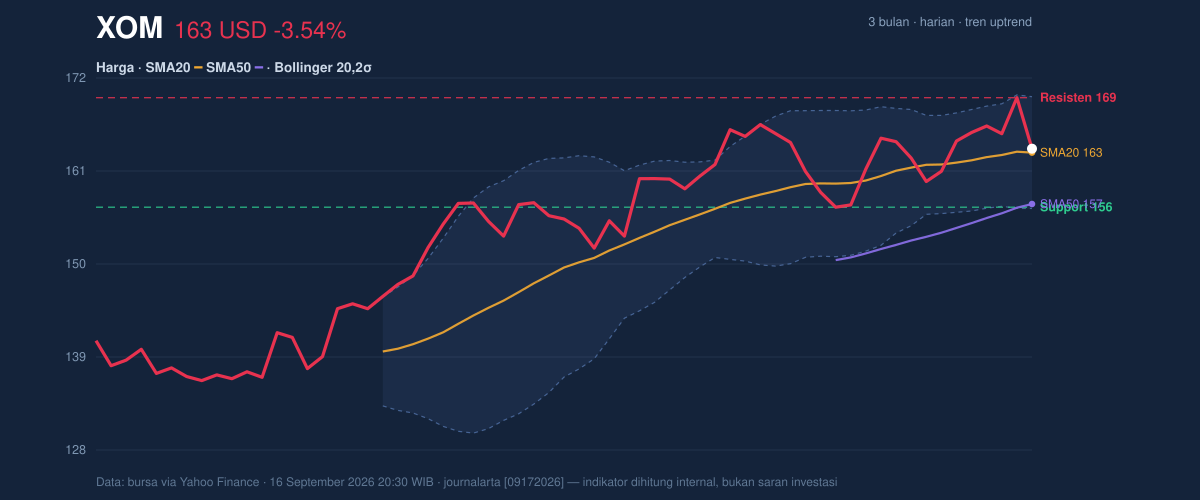
The price is also trading in the upper half of its recent band, at 53% of the 20-hour range between 156.44 support and 169.32 resistance. That placement usually suggests balance rather than breakout pressure: buyers have not lost control, but they have not yet forced a clean move through the ceiling either. The stock is also just below its 3-month high of 169.64, which makes the current zone technically important because traders often watch whether a stock can absorb selling near a prior peak or gets repelled there again.
Oscillators & Momentum
The momentum picture is more mixed than the trend picture. The RSI at 53.3 is neutral, which means the stock is neither stretched nor washed out; in plain language, it is not showing the kind of overheated reading that often precedes a sharp reversal, but it is also not signaling strong fresh upside energy. The Stochastic %K at 55.9 versus %D at 74.2 is also neutral-to-soft, and that gap matters because it shows the faster line has slipped below the slower line, a sign that short-term enthusiasm has cooled.
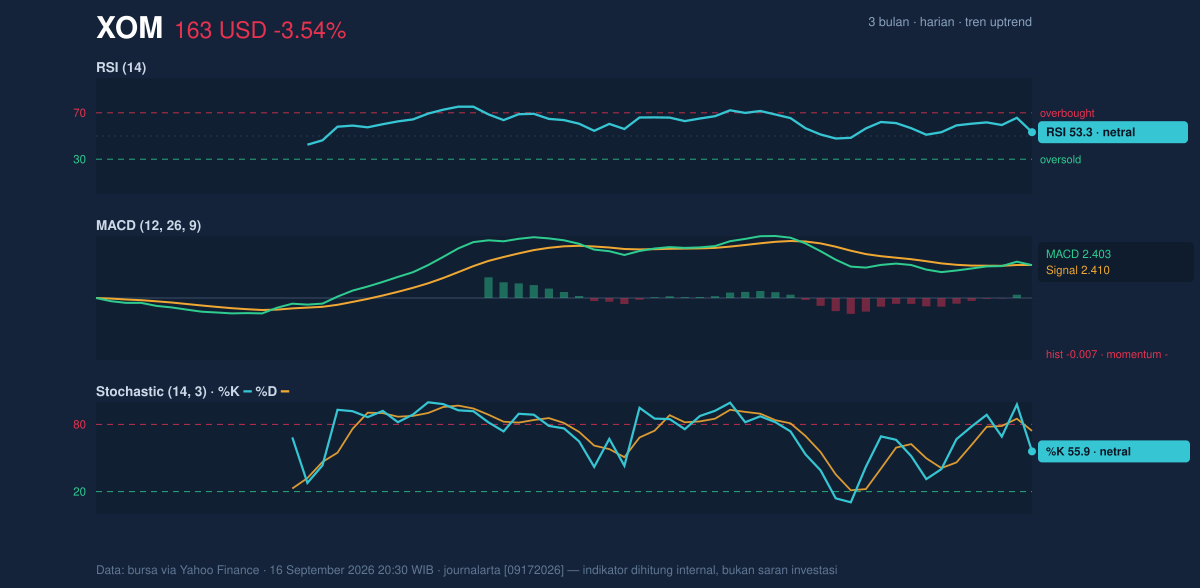
The clearest warning comes from MACD. XOM’s MACD at 2.403 is slightly below its signal at 2.410, with a histogram of -0.007. That is a small negative reading, but it still means momentum has turned marginally negative even though the broader trend remains intact. In practical terms, the stock is not breaking down, but the latest push higher is losing force, so the market may need fresh buying interest to keep the uptrend advancing.
Volatility & Volume
Volatility is moderate rather than extreme. The ATR(14) of 3.89, equal to 2.4% of price, suggests the stock can still move meaningfully in a session, but not in a disorderly way. That matters because it frames the likely trading behavior: XOM has enough daily range to test nearby support or resistance, yet not so much volatility that the chart is being driven by panic or euphoria.
The Bollinger setup is also telling. Price is near the middle of the band structure, with %B at 53%, the upper band at 169.43, and the lower band at 156.29. A normal band width of 8.1% says the stock is not in a volatility squeeze, so there is no strong technical signal of an imminent explosive move. Instead, the bands imply a market that is trading in a fairly standard range and waiting for either a break above resistance or a retreat toward support.
Volume does not yet confirm a decisive shift. Last volume was 13,437,800 versus a 20-day average of 13,751,285, or about 1.0x normal. That is important because a strong breakout usually needs participation above average; here, the market is active enough, but not clearly expanding on the latest move. The fact that OBV is falling adds a second layer of caution: on-balance volume tracks whether volume is accumulating behind price or quietly leaving the stock, and a down OBV suggests the latest price stability is not being strongly reinforced by underlying demand.
Key Levels & Scenarios
The immediate map is fairly clear. 156.44 is the first support to watch, and it lines up closely with the lower Bollinger band at 156.29, which strengthens that area as a likely defense zone. On the upside, 169.32 is the first resistance, with the upper Bollinger band at 169.43 and the 3-month high at 169.64 forming a tight overhead cluster. When several technical markers sit on top of each other, they tend to matter more, because they concentrate supply and make the next move harder.
If XOM can reclaim and hold above 169.32, the chart would begin to look more like a continuation pattern than a stalled advance. If it instead slips below 156.44, the current uptrend would be under pressure, because that would mean price has failed at the lower edge of the recent range and is moving back toward the lower half of the broader structure. The fact that price is still above the SMA50 at 156.82 means the medium-term trend cushion is still there, but it would shrink quickly if support gives way.
Technical Verdict: HOLD (wait & see)
HOLD (wait & see)
- Price remains above SMA20 and SMA50, which keeps the broader trend constructive.
- MACD is slightly negative and OBV is falling, showing that momentum and participation are not fully confirming the uptrend.
- RSI and Stochastic are neutral, so the stock is not oversold enough to suggest a clear rebound setup, nor overbought enough to justify chasing strength.
- Verdict invalidated if price falls below 156.44, because that would break the nearest support and weaken the current trend structure.
- Ideal Entry Range: 156.44 to 162.86
- Exit Target: 169.32 to 169.64
- Stop Loss protection: below 156.29 or, more conservatively, below 156.44
In plain English: XOM still looks technically healthy, but the latest signals say the stock is pausing rather than accelerating, and the next move will be clearer once it either holds support or clears resistance.
Summary Data XOM
| Last price | 163.32 USD |
| Change 1 day / 5 days / 1 month | -3.54% / -0.55% / -1.35% |
| Trend / MA-cross | uptrend / none |
| SMA20 / SMA50 | 162.86 / 156.82 |
| RSI (14) / Stochastic %K | 53.3 / 55.9 |
| Bollinger %B / ATR | 53% / 3.89 |
| Support / Resistance 20 days | 156.44 / 169.32 |
| Data as of | 16 September 2026 20:30 WIB |


