Death Cross Pressure, LLY Stock Gains 0.15% Today
On September 17, 2026: price 1,137.82 USD, trend downtrend, RSI 42.8, support 1,115.70, resistance 1,280.34. technical analysis of lly stock.

Eli Lilly’s shares slipped to 1,137.82 USD on NYSE, edging just 0.15% above the previous close but still sitting well below the short- and medium-term trend lines, according to Yahoo Finance data for 16 September 2026. The move matters less for its size than for what it confirms: the stock is trading in a weakening structure, with sellers still in control even after a modest one-day bounce. The chart shows a name that has not yet found a convincing floor.
Trend & Price Action
The most important signal is that Lilly is now below its SMA20 at 1,174.28 and below its SMA50 at 1,179.91, with the two averages locked in a death cross, meaning the shorter trend has fallen under the longer one. That is usually read as a sign that recent weakness is not just noise, but part of a broader loss of upward momentum. The SMA20 slope of -1.54% over five days reinforces that message: the trend is still pointing lower, not flattening out.
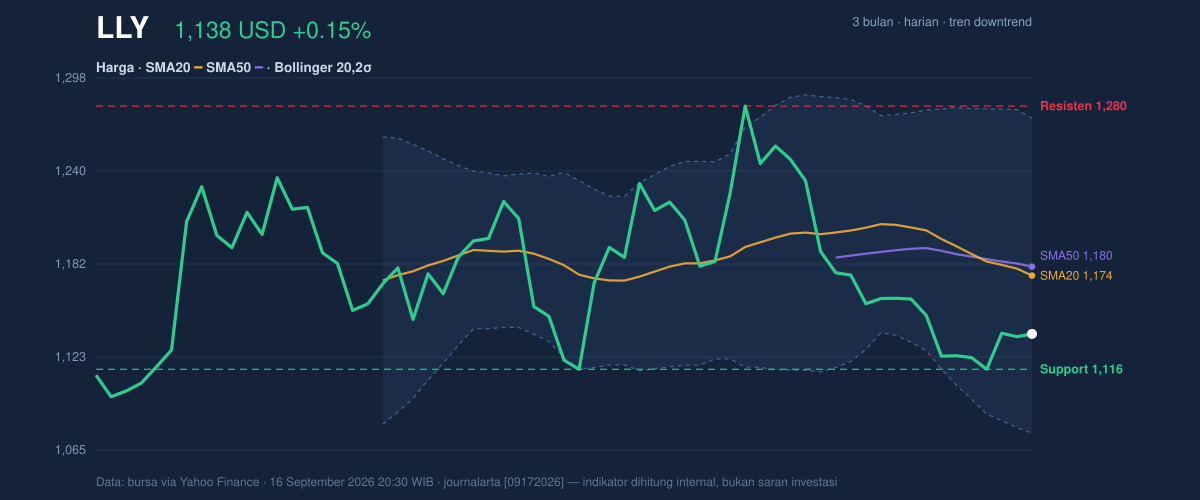
Price is also sitting in the lower part of its recent range, at about 13% of the 20-day band, which tells readers the stock is much closer to support than resistance. The 20-day support at 1,115.70 is now the nearest line that matters. Below that, the market would be moving toward the lower Bollinger band at 1,075.77 and the 3-month low of 1,079.22, a zone that would likely attract attention from traders watching for capitulation or a failed breakdown. On the upside, the 20-day resistance at 1,280.34 remains a long way off, and that gap shows how much work the stock would need to do before the chart improves.
Oscillators & Momentum
The momentum picture is less dramatic than the trend picture, but it is still not encouraging. The RSI at 42.8 is neutral, which means the stock is not technically oversold yet and therefore does not have the kind of stretched condition that often precedes a sharp reflex bounce. In plain terms, the market has room to weaken further before momentum indicators start flashing extreme fear.
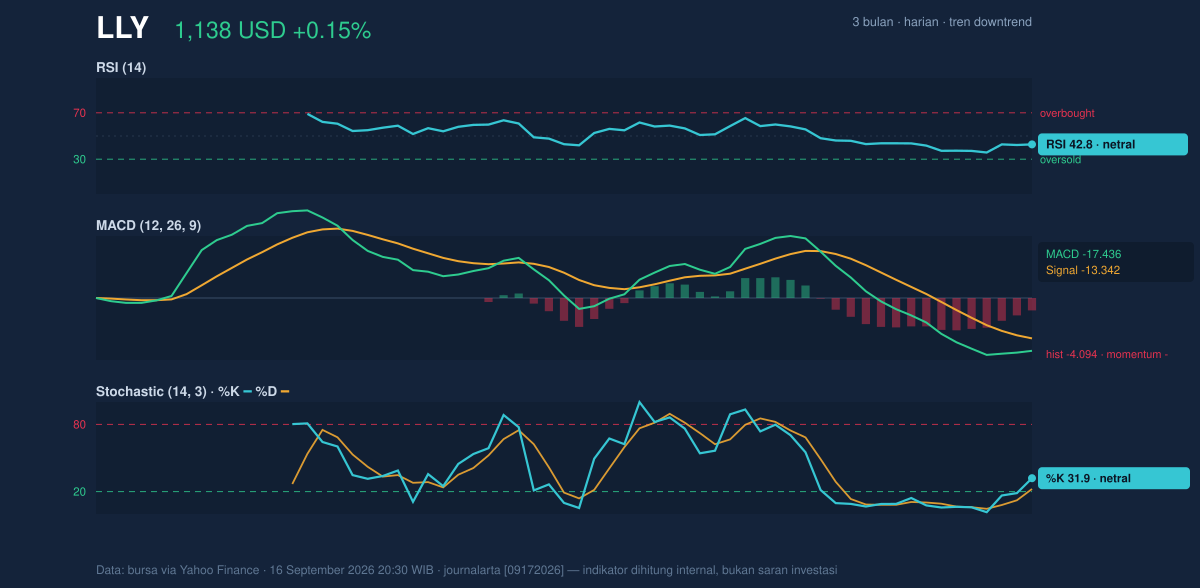
The Stochastic reading of 31.9 / 22.4 is also neutral, though it sits closer to the lower end of its scale, hinting that short-term selling pressure has cooled somewhat. That cooling is not the same as a reversal. The MACD at -17.436, with the signal line at -13.342 and a histogram of -4.094, is the clearest warning in the set. MACD measures whether momentum is accelerating or fading; here, it says the down move still has negative force behind it. The fact that the histogram is below zero means the gap between the MACD line and its signal remains unfavorable, so the stock has not yet shown a clean momentum turn.
Volatility & Volume
Volatility is present, but not explosive. The ATR(14) of 25.23, or 2.2% of price, suggests the stock is moving enough to matter day to day, yet not in a panic-like regime. The Bollinger band width of 16.8% is described as normal, which means the stock is not in a squeeze that often precedes a sharp breakout. Instead, the price is drifting inside a standard volatility envelope, with the %B at 31% showing it is closer to the lower band than the middle line. That positioning usually signals pressure rather than strength.
Volume adds another cautionary layer. The latest session saw 1,475,400 shares trade versus a 20-day average of 2,410,350, or about 0.6x normal. Lower volume on a weak chart can mean the market is not yet panicking, but it also means buyers have not stepped in with conviction. The OBV is falling, which is important because on-balance volume tracks whether money flow is supporting the move. A declining OBV alongside a downtrend suggests distribution, or persistent selling pressure, rather than quiet accumulation.
Key Levels & Scenarios
The nearest decision zone is the support at 1,115.70. If the stock holds above that level, the chart could continue to stabilize inside the current range, but it would still need to reclaim the SMA20 at 1,174.28 and then the SMA50 at 1,179.91 before the trend damage starts to ease. If it fails to hold 1,115.70, the next reference becomes the lower Bollinger band at 1,075.77, near the 3-month low of 1,079.22. That is the area where traders would watch closely for either a rebound or a deeper breakdown.
The upside scenario is more demanding. A move back above the moving averages would need to be backed by stronger volume and a firmer MACD turn, otherwise any bounce risks being treated as a short-lived recovery inside a larger downtrend. As shown in the chart, price is still positioned below the key trend markers, which keeps the burden on the bulls.
Technical Verdict: HOLD (wait & see)
- The death cross and price below SMA20 and SMA50 keep the trend negative.
- The MACD remains below signal, which says downside momentum is still active.
- The RSI at 42.8 and Stochastic at 31.9 / 22.4 are not oversold enough to confirm a durable reversal.
- Verdict invalidated if price breaks above 1,179.91, because that would challenge the current bearish structure around the moving averages.
- Ideal entry range: 1,115.70 to 1,075.77
- Exit target: 1,174.28 to 1,179.91
- Stop loss protection: below 1,075.77
For non-traders, this means the chart is not broken beyond repair, but it is still leaning the wrong way and needs proof before confidence returns.
“Right now, the stock is asking for evidence, not optimism.”
Summary Data LLY
| Last price | 1,137.82 USD |
| Change 1 day / 5 days / 1 month | 0.15% / 1.21% / -7.17% |
| Trend / MA-cross | downtrend / death |
| SMA20 / SMA50 | 1,174.28 / 1,179.91 |
| RSI (14) / Stochastic %K | 42.8 / 31.9 |
| Bollinger %B / ATR | 31% / 25.23 |
| Support / Resistance 20 days | 1,115.70 / 1,280.34 |
| Data as of | 16 September 2026 20:30 WIB |


