AMD Stock Technicals Today: Gains 1.65%, Momentum Gains
On September 17, 2026: price 512.50 USD, trend sideways, RSI 56.1, support 456.16, resistance 521.10. technical analysis of amd stock. AMD Stock Technicals —…

AMD is holding near the top of its recent trading band, which matters because the stock is trying to extend strength without yet proving a clean breakout. On 16 September 2026 at 20:30 WIB, Advanced Micro Devices finished at 512.50 USD, up 1.65% on the day, after a modest 1.65% decline over five days and a 5.80% gain over one month, according to market data from Yahoo Finance via the exchange feed.
Trend & Price Action
The broader picture is not a sharp uptrend or a breakdown, but a sideways pattern with a slight upward tilt in the short-term average. The stock is trading above the SMA20 at 482.30 and also above the SMA50 at 495.03, which tells readers that recent buying has been strong enough to keep price above both the short- and medium-term trend guides. That is constructive, but the absence of a fresh MA-cross — meaning no new crossover between the moving averages — signals that the market has not yet generated a stronger trend confirmation.
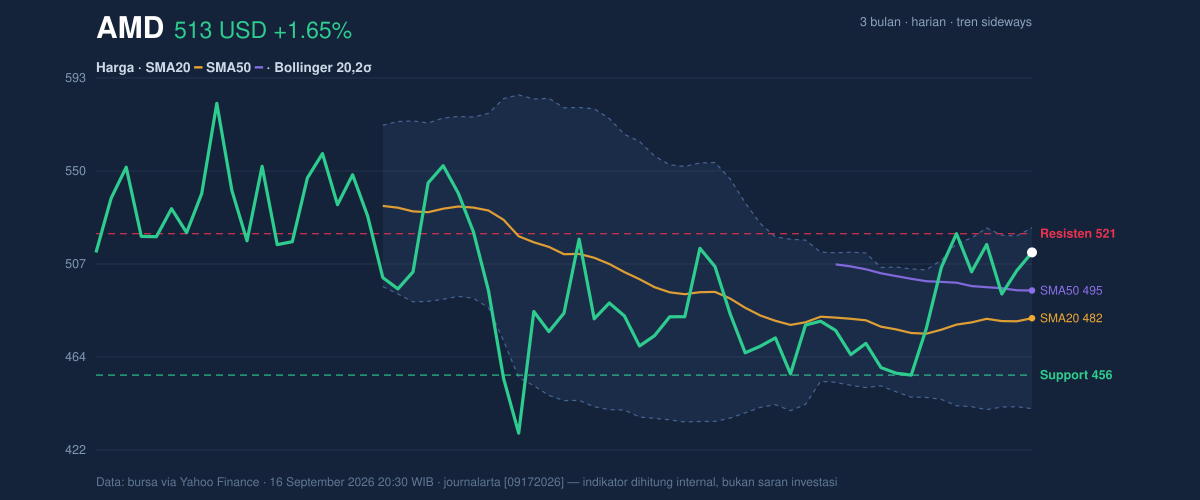
The chart also shows price sitting near the upper end of its 20-hour range, at 87% of that band, with support at 456.16 and resistance at 521.10. In plain terms, AMD is closer to the ceiling than the floor, so the market is asking whether momentum can push through resistance or whether the stock needs to cool off first. The broader 3-month range, from 424.03 to 584.73, frames that move: AMD is not at the extreme, but it is no longer in the middle either.
Oscillators & Momentum
Momentum is mixed, and that is the most important signal in the current setup. The RSI at 56.1 is neutral, which means the stock is neither stretched nor washed out on this measure. That matters because RSI often acts like a temperature gauge: a reading near 50 suggests balance, while a much higher reading can warn that enthusiasm is getting crowded.
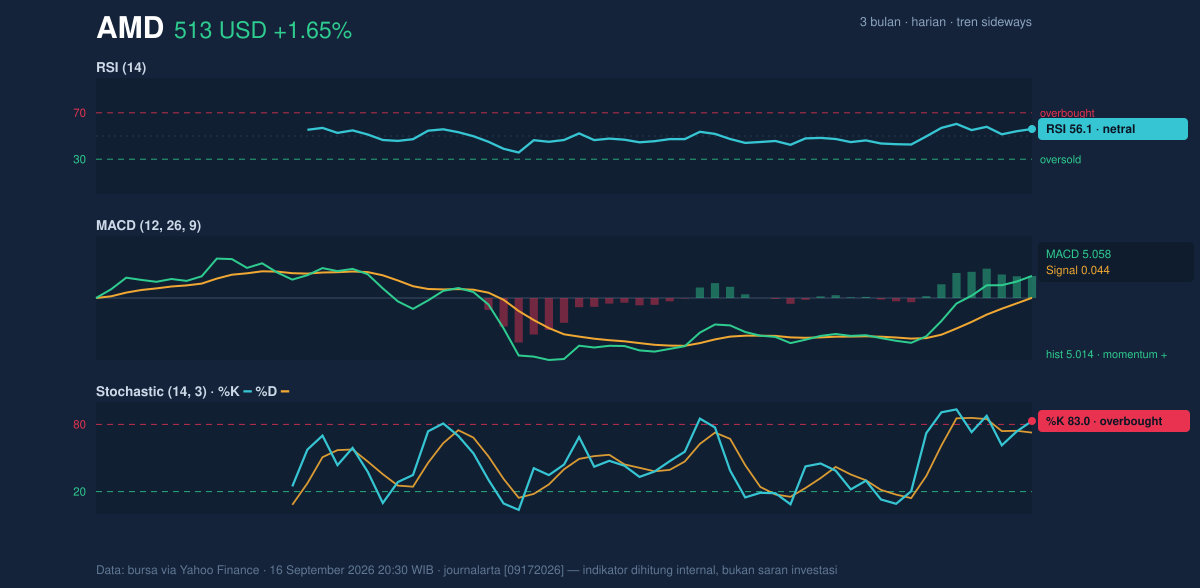
The Stochastic oscillator is more demanding. With %K at 83.0 and %D at 72.7, AMD is in overbought territory, meaning recent closes have been pressed toward the upper end of the range faster than the broader trend has improved. This does not automatically mean reversal, but it does mean the stock may need either a pause or a breakout to justify further gains. The MACD is positive at 5.058, with the signal line at 0.044 and a 5.014 histogram, which is a clear sign that upward momentum still dominates the trend structure. In short: the oscillators are not aligned. RSI says “steady,” Stochastic says “stretched,” and MACD says “momentum remains positive.”
Volatility & Volume
Volatility is elevated enough to matter. The ATR at 20.15, equal to 3.9% of price, shows that daily swings are still meaningful, so traders should expect AMD to move in wide increments rather than drift calmly. Bollinger Bands reinforce that message. Price is trading below the upper band at 523.86 but well above the middle band at 482.30, with %B at 86% and a normal band width of 17.2%. That combination suggests the stock is pressing into the upper part of its recent volatility envelope, but the band structure is not in a squeeze. Put simply, the market is active, not compressed, so any breakout attempt should have room to move — but also room to fail.
Volume supports the move, at least for now. The latest turnover of 22,193,900 shares was about 1.2× the 20-hour average of 17,757,430, and OBV is rising. That is important because price gains are more credible when they come with participation. Rising OBV means volume has been accumulating in a way that often accompanies sustained demand, not just a one-off spike. Still, volume alone cannot override the fact that AMD is already near resistance and overbought on Stochastic.
Key Levels & Scenarios
The immediate technical map is clear. Resistance at 521.10 is the first barrier, and the Bollinger upper band at 523.86 sits just above it, making that zone the real test for continuation. If AMD pushes through that area and holds, the stock would be signaling that buyers are willing to pay above the recent range ceiling, which could shift the chart from range-trading to breakout behavior. If it fails there, the more likely result is a pullback toward the moving averages, where SMA20 at 482.30 and SMA50 at 495.03 become the next reference points.
On the downside, support at 456.16 is the key line that would tell the market whether this rally has enough depth. A break below that level would weaken the current structure and suggest the recent advance is losing traction. The fact that price is already above both moving averages means AMD has a cushion, but not a guarantee.
Technical Verdict: HOLD (wait & see)
HOLD (wait & see) because the chart shows constructive trend support, but momentum is not fully synchronized with price.
- MACD is positive, showing trend momentum still leans upward.
- Price is above SMA20 and SMA50, which keeps the short- and medium-term structure intact.
- Stochastic is overbought and price is near resistance at 521.10, so upside may need confirmation rather than assumption.
Verdict invalidated if price falls below 456.16.
- Ideal entry range: 482.30 to 495.03
- Exit target: 521.10 to 523.86
- Stop loss protection: below 456.16
For non-traders, that means AMD still looks technically healthy, but the stock is close enough to resistance that the next move needs to prove itself before the chart can be trusted more fully. “It’s holding, but it hasn’t finished the argument.”
Summary Data AMD
| Last price | 512.50 USD |
| Change 1 day / 5 days / 1 month | 1.65% / -1.65% / 5.80% |
| Trend / MA-cross | sideways / none |
| SMA20 / SMA50 | 482.30 / 495.03 |
| RSI (14) / Stochastic %K | 56.1 / 83.0 |
| Bollinger %B / ATR | 86% / 20.15 |
| Support / Resistance 20 days | 456.16 / 521.10 |
| Data as of | 16 September 2026 20:30 WIB |


