CRM Stock Gains 1.83% Today, Momentum Gains
On Agustus 3, 2026: price 184.02 USD, trend sideways, RSI 59.7, support 156.93, resistance 188.38. technical analysis of crm stock. CRM Stock Gains — full…

Salesforce rose to 184.02 USD on the NYSE, extending a short-term recovery that has pushed the stock to 86% of its 20-session range and within striking distance of the 188.38 USD resistance, according to Yahoo Finance data as of 31 July 2026 20:30 WIB. The move is constructive, but not unqualified. The chart shows a stock that is gaining altitude while momentum indicators begin to look stretched, which often means the next move depends less on direction than on whether buyers can keep the advance orderly.
Trend & Price Action
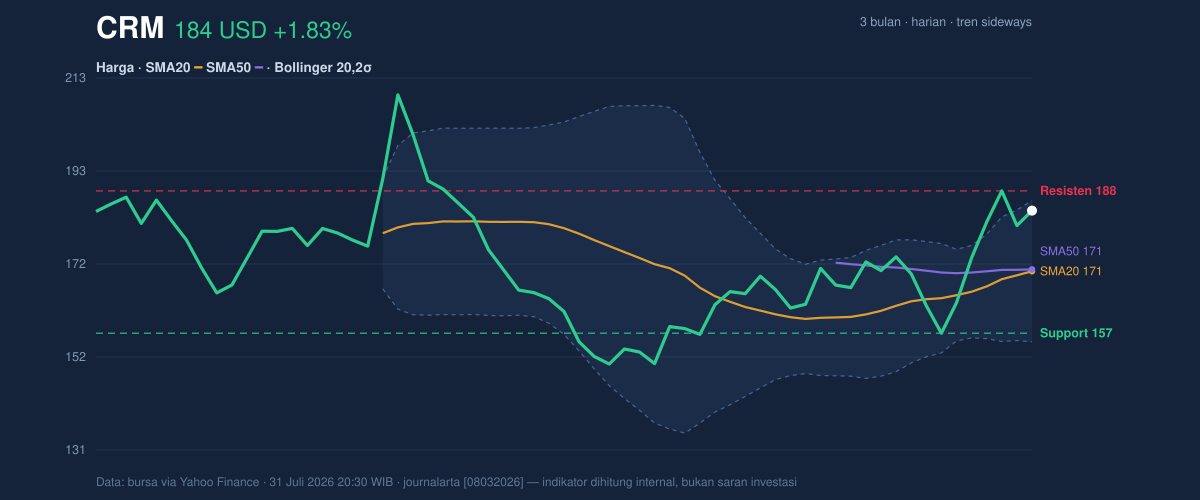
Salesforce is still described as sideways, yet the price action has improved enough to challenge that label. The stock now sits above SMA20 at 170.62 USD and also above SMA50 at 171.03 USD, which tells traders that the near-term market is trading above both its short- and medium-term trend references. That matters because when price holds above these moving averages, it usually signals that recent buyers are willing to pay up rather than wait for pullbacks.
The key nuance is that there is no new MA-cross, so this is not a fresh trend reversal driven by a classic moving-average crossover. Instead, the stock is climbing within an existing range, helped by a 3.20% five-day slope in SMA20, which suggests the short-term trend is tilting upward even if the broader structure has not fully broken out.
The price is also trading near the upper band of its recent range, with support at 156.93 USD and resistance at 188.38 USD. As shown in the chart, the current level is closer to resistance than support, which usually means the market is testing whether the recent advance is strong enough to absorb profit-taking.
Oscillators & Momentum
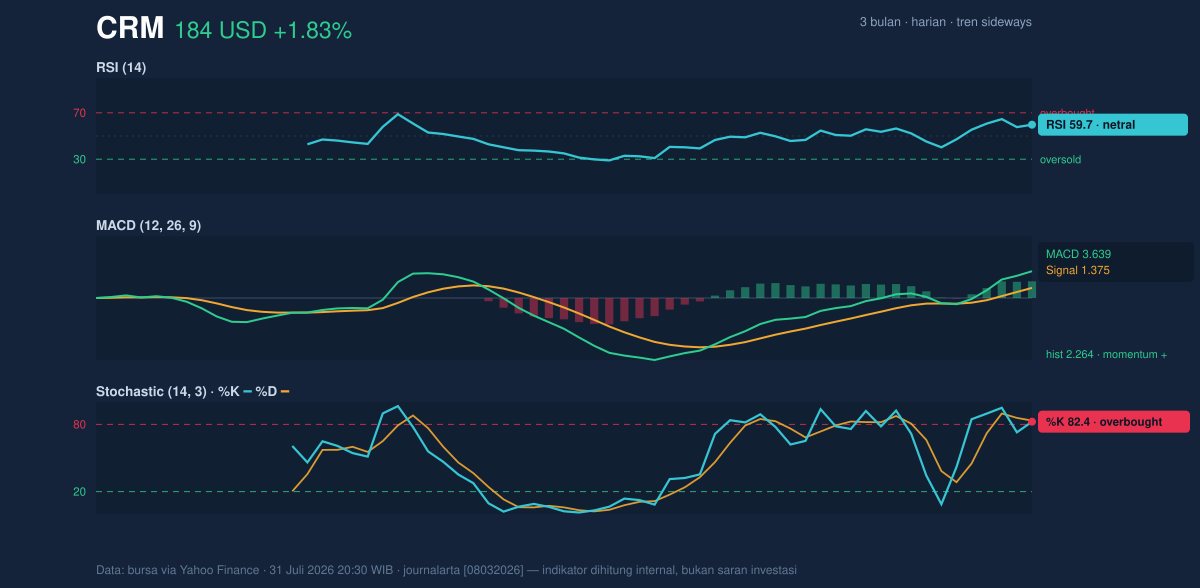
The momentum picture is more mixed than the price chart alone suggests. The RSI at 59.7 is still neutral, so the stock is not yet in a classic overbought state on that measure. But the Stochastic %K at 82.4 and %D at 83.4 are both overbought, which signals that the latest rally has moved quickly enough that short-term upside may be getting crowded.
That distinction matters. RSI often reflects broader momentum, while Stochastic is more sensitive to near-term turning points. Here, RSI says the move is healthy; Stochastic says it is getting extended. In practical terms, the stock can still rise, but the odds of pauses or intraday reversals increase when Stochastic stays above 80.
The MACD at 3.639, above its signal line at 1.375, with a histogram of 2.264, remains positive. That is the clearest confirmation in the data that trend momentum is still on the bulls’ side. MACD above signal line means the recent price trend is stronger than the longer baseline, and the positive histogram shows that gap is still widening. As shown in the momentum chart, that is the main reason the rally has not yet lost traction.
Volatility & Volume
Volatility is elevated even if the Bollinger bands are not unusually wide. The ATR at 8.87 USD, or 4.8% of price, indicates that day-to-day swings are still meaningful. For readers, ATR is a measure of typical movement size; a higher reading means the stock can travel farther in either direction without changing the broader trend.
The Bollinger setup is also important. Price is sitting near the upper band at 186.22 USD, with %B at 93%. That means the stock is trading very close to the top of its recent volatility envelope. In plain language, the market has already done much of the work needed to reach the upper edge of the range, so upside continuation would likely require fresh buying rather than just momentum carryover. The 18.3% band width is described as normal, which suggests this is not a volatility breakout environment yet; it is more of a controlled advance within a standard range.
Volume does not fully confirm the move. The latest volume of 9,686,300 is only 0.8× normal versus the 20-session average of 12,769,165. That means the rally is happening without full participation from the broader market. Still, OBV is rising, which is a useful counterweight: on-balance volume tracks whether volume tends to come in on up days or down days, and a rising OBV implies underlying accumulation even when the raw session volume is not exceptional.
Key Levels & Scenarios
The market is now boxed between a nearby ceiling and a deeper floor. The first level to watch is 188.38 USD resistance. A clean move through that area would suggest the recent advance is escaping the current range rather than simply testing the top of it. On the downside, 170.62 USD and 171.03 USD are the first technical reference points because they mark the two moving averages the stock has reclaimed. Below that, 156.93 USD support is the main protection zone, and failure there would weaken the current bullish structure.
The broader map matters too: the stock remains below the 3-month high of 211.34 USD and above the 3-month low of 146.32 USD. That places CRM in the upper half of its recent multi-month range, which is consistent with recovery but not yet with a full trend reset.
The core signal is that Salesforce is advancing with positive MACD and rising OBV, but overbought Stochastic and proximity to Bollinger resistance show the move is extended rather than effortless.
Technical Verdict: HOLD (wait & see)
- Reason 1: MACD is positive and above signal, which supports the current upward push.
- Reason 2: Price is above SMA20 and SMA50, showing short-term trend improvement.
- Reason 3: Stochastic is overbought and price is near Bollinger upper band at 186.22 USD, so upside looks stretched.
- Verdict invalidated if price breaks below 156.93 USD, the 20-session support.
- Ideal Entry Range: 170.62–171.03 USD on a pullback toward the moving averages
- Exit Target: 188.38 USD resistance
- Stop Loss protection: 156.93 USD support
For non-traders: the stock looks stronger than it did a few sessions ago, but it is close enough to resistance that the chart is asking for confirmation rather than enthusiasm.
Summary Data CRM
| Last price | 184.02 USD |
| Change 1 day / 5 days / 1 month | 1.83% / 12.44% / 10.78% |
| Trend / MA-cross | sideways / none |
| SMA20 / SMA50 | 170.62 / 171.03 |
| RSI (14) / Stochastic %K | 59.7 / 82.4 |
| Bollinger %B / ATR | 93% / 8.87 |
| Support / Resistance 20 days | 156.93 / 188.38 |
| Data as of | 31 Juli 2026 20:30 WIB |


