ORCL Stock Analysis: Gains 1.81%, Momentum Gains
On Agustus 3, 2026: price 129.87 USD, trend sideways, RSI 44.0, support 114.99, resistance 144.22. technical analysis of orcl stock. ORCL Stock Analysis — full…

Oracle is trading in a market that is trying to recover, but not yet in a clean uptrend: the shares closed at 129.87 USD, up from 127.56 in the prior session, while the broader chart still shows a sideways structure with elevated volatility. For international readers, that means the stock is moving, but the signal is more about range-trading and repositioning than a decisive trend reversal.
Trend & Price Action
The most important feature in Oracle’s chart is the gap between the current price and the longer trend line. The stock is trading above the SMA20 at 128.88, which is a short-term constructive sign because it shows price has recently reclaimed its near-term average. But it remains far below the SMA50 at 164.92, which tells a different story: the medium-term trend is still under pressure, and the recovery has not yet repaired the broader damage. The absence of a new MA-cross reinforces that this is not a fresh trend signal; it is a market still searching for direction.
The Bollinger Bands help explain the current mood. Price sits near the band midpoint at 128.88, with %B at 53%, meaning Oracle is only modestly above the middle of its recent range rather than pressing the upper band. That middle-band position usually signals balance, not breakout. At the same time, the 27.5% band width and the note that volatility is high indicate the range itself has widened, so the stock can move quickly if a catalyst appears.
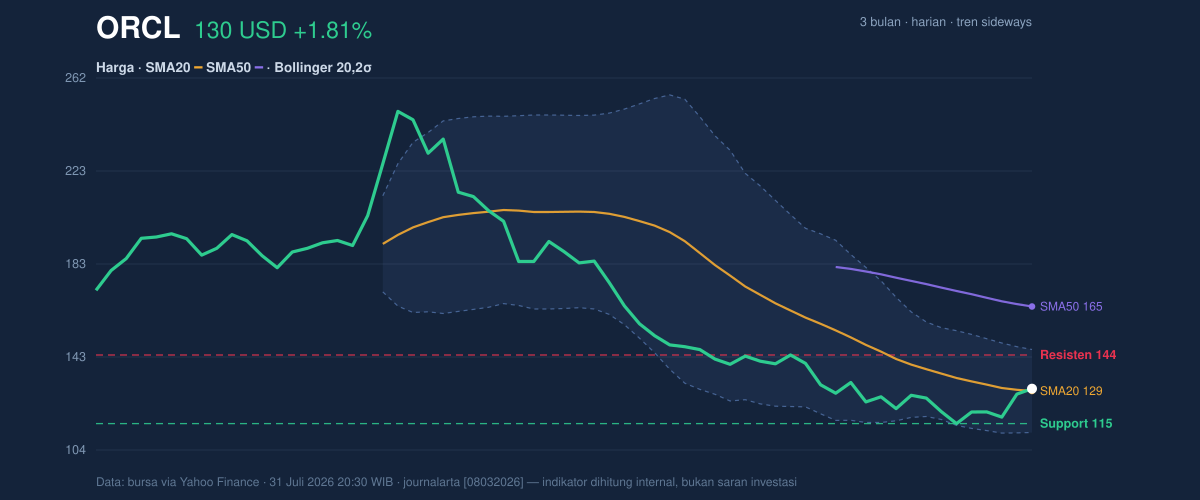
The chart shows a stock that has repaired some short-term damage, but not enough to declare a trend change.
The range boundaries matter. Oracle is trading around the middle of the 20-hour support at 114.99 and resistance at 144.22, sitting at roughly 51% of that range. That placement matters because it suggests neither side has full control: buyers have defended the lower part of the range, but they have not yet forced price into the upper half with conviction. The 3-month low at 114.50 sits close to support, while the 3-month high at 250.25 remains far above, underscoring how much ground would need to be recovered for the larger downtrend to be meaningfully repaired.
Oscillators & Momentum
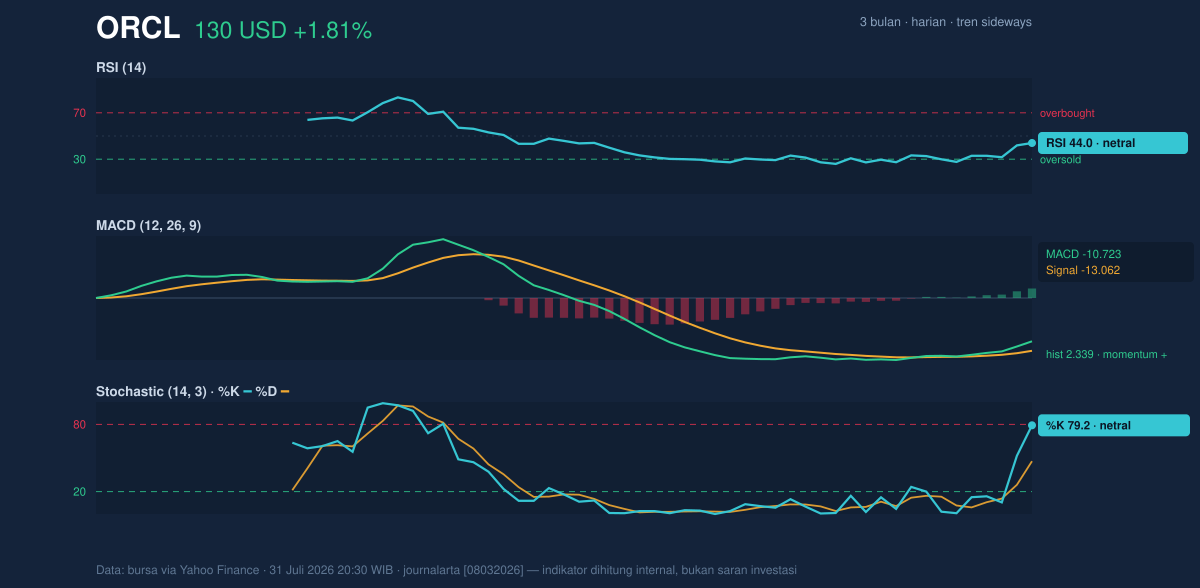
Momentum is mixed, but not bearish in the immediate sense. The RSI at 44.0 is neutral, which means the stock is neither overbought nor oversold. That matters because it leaves room for movement in either direction without the chart being stretched. The Stochastic %K at 79.2 versus %D at 47.2 is more interesting: the fast line is elevated, suggesting a recent burst of buying pressure, but because it is still labeled neutral and not paired with stronger trend confirmation, it reads more like a short-term rebound than a fully established momentum regime.
The clearest technical support comes from the MACD at -10.723 versus the signal at -13.062, with a 2.339 histogram. In plain English, MACD is still below zero, so the longer momentum backdrop remains weak, but the histogram turning positive means downside force has eased and momentum is improving from a low base. That is a constructive shift, but it is not the same as a full trend reversal.
In other words: momentum is healing, not healed.
Volatility & Volume
Oracle’s ATR at 6.86, equal to 5.3% of price, says daily swings are still large relative to the stock’s level. ATR measures typical movement; when it is elevated, stops and breakouts become more meaningful because price can travel farther in a short time. The widening Bollinger Bands reinforce that message. Compression has not been the story here; expansion has. That usually means the market is processing new information or adjusting to a sharp change in sentiment.
Volume adds a useful caution. The latest volume of 34,373,400 is below the 20-hour average of 38,622,725, or about 0.9x normal. That means the recent bounce has not yet been backed by heavier participation. However, OBV is rising, which suggests the balance of volume has still been favorable over time even if the latest session was not especially active. In technical terms, OBV rising while price stabilizes often indicates accumulation is quietly building beneath the surface.
Key Levels & Scenarios
The nearest technical map is straightforward. 114.99 is the key support to watch, and 144.22 is the first major resistance. The current price at 129.87 sits between them, which is why the chart reads as a holding pattern with a bullish bias only at the margin. A sustained move above resistance would suggest the rebound has room to extend toward the upper Bollinger band at 146.59, but failure to hold above the SMA20 at 128.88 would weaken the short-term recovery narrative and put the lower range back in focus.
If price slips back below 114.99, the chart would lose its nearest support cushion and reopen pressure toward the 114.50 3-month low. If price clears 144.22, the market would be signaling that the recent rebound has enough strength to challenge the upper band and move out of the current mid-range drift.
Technical Verdict: HOLD (wait & see)
- Reason 1: Price is above the SMA20 at 128.88, which supports the short-term bounce.
- Reason 2: MACD is still negative but the positive histogram at 2.339 shows momentum is improving.
- Reason 3: RSI at 44.0 and Stochastic %K at 79.2 / %D at 47.2 are not confirming a clean breakout, while price remains well below the SMA50 at 164.92.
- Verdict invalidated if price falls below 114.99, because that would break the nearest support and weaken the current recovery structure.
- Ideal Entry Range: 128.88 to 129.87
- Exit Target: 144.22 to 146.59
- Stop Loss protection: below 114.99
For non-traders, this means Oracle is trying to recover, but the chart still needs proof before the move can be trusted.
“The stock is no longer falling apart, but it has not yet earned the right to be called strong.”
Summary Data ORCL
| Last price | 129.87 USD |
| Change 1 day / 5 days / 1 month | 1.81% / 12.94% / -7.41% |
| Trend / MA-cross | sideways / none |
| SMA20 / SMA50 | 128.88 / 164.92 |
| RSI (14) / Stochastic %K | 44.0 / 79.2 |
| Bollinger %B / ATR | 53% / 6.86 |
| Support / Resistance 20 days | 114.99 / 144.22 |
| Data as of | 31 Juli 2026 20:30 WIB |

