VZ Stock Technicals Today: Gains 1.52%, Momentum Gains
On Agustus 3, 2026: price 46.81 USD, trend sideways, RSI 58.7, support 42.07, resistance 48.19. technical analysis of vz stock. VZ Stock Technicals — full…

Verizon Communications Inc. traded higher on the NYSE on 31 July 2026, with VZ last at 46.81 USD, up from the prior close of 46.11, as the stock continued to recover within a broad sideways pattern. The move matters less as a headline breakout than as evidence that buyers are still willing to pay above the short-term trend lines; the share price is now above SMA20 at 44.22 and above SMA50 at 45.47, which tells investors the recent rebound has enough structure to stay intact for now.
Trend & Price Action
The chart shows a stock that is not trending cleanly in one direction, but it is no longer drifting aimlessly either. The trend is sideways, yet the slope of the SMA20 is up 2.09% over 5 days, which signals a short-term improvement inside a larger consolidation. That distinction matters: sideways markets often frustrate momentum traders, but an upward tilt in the faster average suggests the balance of power has shifted modestly toward demand.
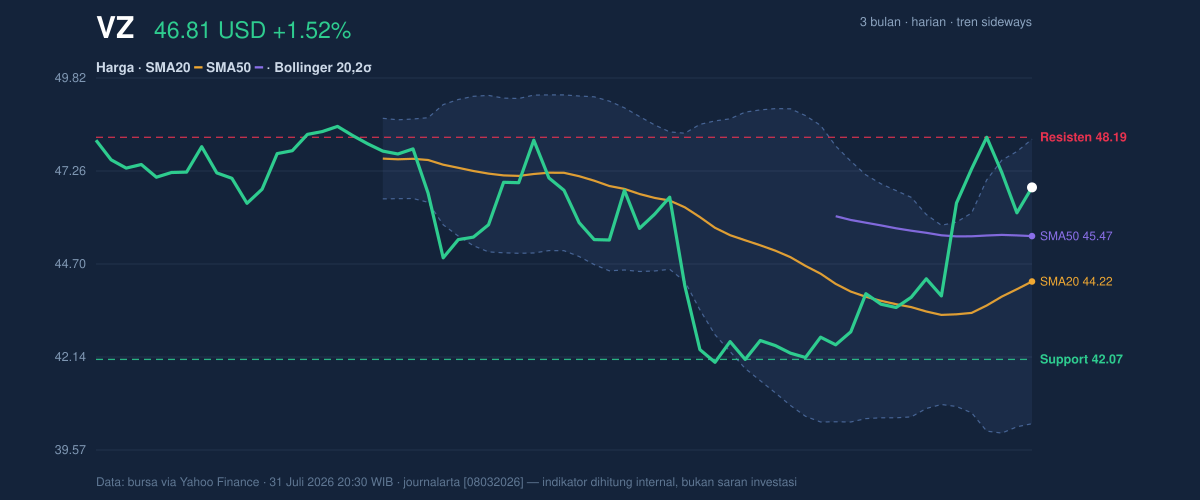
Verizon is also trading in the upper part of its recent range, with price at 77% of the 20-hour range between support at 42.07 and resistance at 48.19. In plain terms, the stock is closer to the ceiling than the floor, which usually means the market has already done much of the near-term work and now needs fresh buying to extend higher. The position is reinforced by the 3-month range: the stock sits below the 3-month high of 49.01 but well above the 3-month low of 40.76, leaving it in the upper half of the broader band without yet proving a full breakout.
The Bollinger bands help explain why the move has room but not much comfort. %B at 83% shows the price is pressing near the upper band, while the band width of 17.7% is normal rather than compressed. That combination means the stock is not in a volatility squeeze that would usually precede a sharp expansion; instead, it is already moving within a fairly ordinary envelope, so further gains may require follow-through rather than simply a quiet drift.
Oscillators & Momentum
The momentum picture is constructive, but not overheated. RSI at 58.7 is neutral, which means the stock has room to rise without immediately entering overbought territory, yet it is also not showing the kind of deep pullback that would imply a bargain setup. Stochastic at 67.6 / 67.2 is also neutral and hovering in the upper middle of its range, a sign that recent strength has been steady rather than explosive.
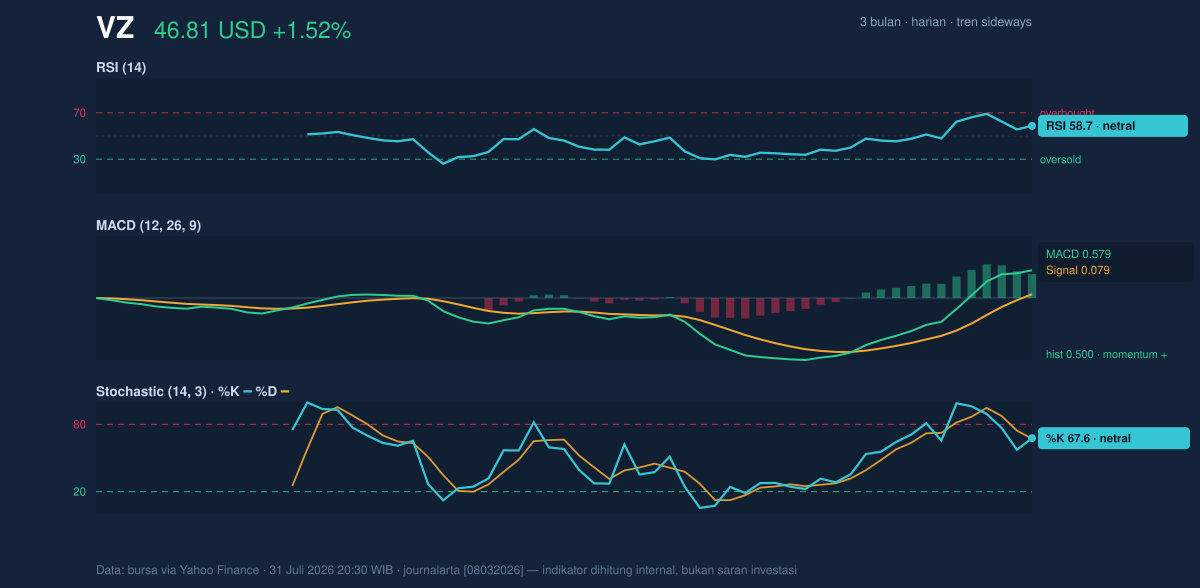
The clearest signal comes from MACD. MACD at 0.579 sits above the signal line at 0.079, with a histogram of 0.500, which means upward momentum is still positive and has not yet rolled over. For readers unfamiliar with the term, MACD is a trend-following gauge: when the main line stays above the signal line and the histogram remains positive, it usually means buying pressure is still outpacing selling pressure. In Verizon’s case, that positive reading is important because it confirms the recent price lift instead of contradicting it.
The key nuance is that the oscillators are not screaming strength. They are aligned, but only moderately so. That often fits a defensive, income-oriented large-cap stock: gradual accumulation rather than speculative acceleration. The absence of an overbought reading also leaves some room for the stock to test higher levels if buyers remain patient.
Volatility & Volume
Volume gives the move more credibility. Last volume was 28,277,600, almost exactly in line with the 20-day average of 28,776,560, or 1.0× normal. That means the latest advance was not a thin, low-participation pop. It also was not a dramatic surge that would suggest panic buying, but in technical terms, matching average volume is enough to show the move has the market’s attention.
The OBV is rising, and that matters because on-balance volume tracks whether money is flowing into the stock over time. A rising OBV alongside a price recovery usually indicates accumulation: buyers are showing up consistently, even if they are not yet forcing a breakout. The ATR at 1.42, equal to 3.0% of price, points to moderate volatility. That suggests the stock can move, but not violently; traders should expect measured swings rather than sharp gaps unless the price approaches the range edges.
Key Levels & Scenarios
The nearest barrier is clear. Resistance at 48.19 sits just above the current price and near the 3-month high of 49.01, so that zone is the market’s real test. If Verizon can clear that area, it would signal that the rebound is no longer just a bounce inside a range but a stronger attempt to reclaim the upper end of the three-month structure.
On the downside, support at 42.07 is the important floor in the current setup. A move back toward that level would suggest the recent advance has faded and that the stock is returning to the lower half of its range. The middle Bollinger line at 44.22 also acts as a practical pivot: staying above it keeps the short-term tone constructive, while losing it would weaken the argument that momentum is still improving.
Technical Verdict: HOLD (wait & see)
HOLD (wait & see)
- RSI at 58.7 and Stochastic at 67.6 / 67.2 are supportive but not decisive, so momentum is positive without being strong enough to call a breakout.
- MACD is positive, with the main line above the signal line and a 0.500 histogram, which confirms the rebound is still active.
- Price is above SMA20 and SMA50, but %B at 83% shows the stock is already near the upper Bollinger band and approaching 48.19 resistance, where follow-through becomes the real test.
Verdict invalidated if price falls below 42.07, because that would break the current support floor and weaken the sideways-to-firm structure.
- Ideal Entry Range: 44.22 to 45.47
- Exit Target: 48.14 to 48.19
- Stop Loss protection: below 42.07
For non-traders, this means Verizon looks steady and improving, but it still needs to prove it can get through resistance before the chart turns from constructive to compelling.
"At 48.19, the market has to decide whether this is just a bounce or the start of something bigger."
Summary Data VZ
| Last price | 46.81 USD |
| Change 1 day / 5 days / 1 month | 1.52% / 0.93% / 9.99% |
| Trend / MA-cross | sideways / none |
| SMA20 / SMA50 | 44.22 / 45.47 |
| RSI (14) / Stochastic %K | 58.7 / 67.6 |
| Bollinger %B / ATR | 83% / 1.42 |
| Support / Resistance 20 days | 42.07 / 48.19 |
| Data as of | 31 Juli 2026 20:30 WIB |


