AstraZeneca Momentum Weakens: Stock Gains 0.39% (Agustus 10, 2026)
On Agustus 10, 2026: price 11,896.00 GBp, trend downtrend, RSI 37.7, support 11,500.00, resistance 13,134.00. technical analysis of astrazeneca stock.

AstraZeneca shares on the LSE were last quoted at 11,896.00 GBp, up 0.39% on the day, but the small bounce sits inside a broader slide: the stock is down 5.83% over five days and 7.31% over one month, according to market data from Yahoo Finance via the exchange. That matters because a one-day gain means little when price is still trading below both its short- and medium-term trend lines, which usually tells investors the market is still selling rallies rather than rewarding them.
Trend & Price Action
The chart shows AstraZeneca in a downtrend, with the SMA20 at 12,451.50 and the SMA50 at 13,197.96, while the share price remains below the SMA20. In plain English, that means the stock is trading under both its recent average price and its longer average price, a classic sign that momentum has not yet turned back in the bulls’ favour.
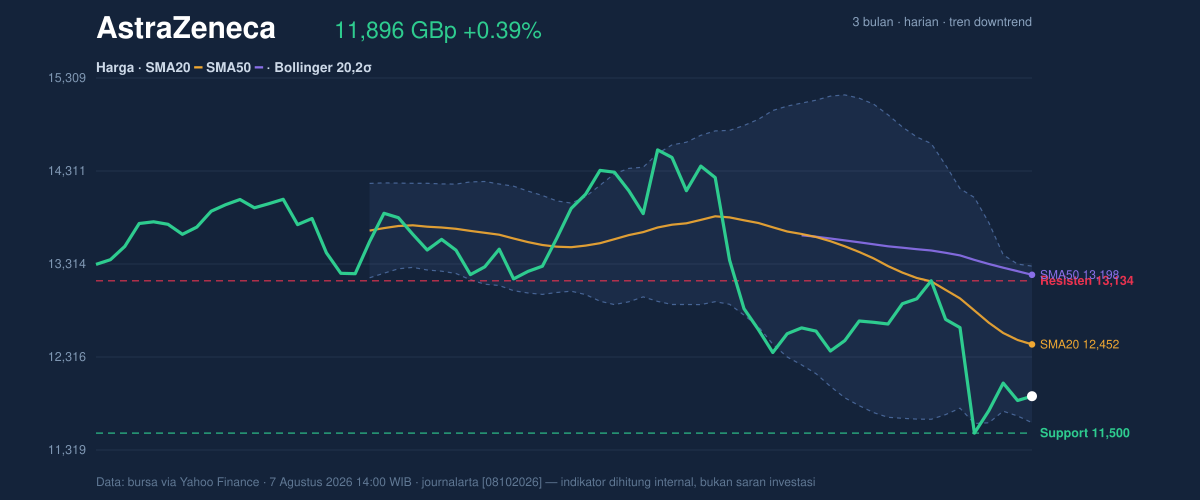
The slope of the SMA20 at -3.81% over five days reinforces that picture. A falling short-term average usually signals that recent closes are still pulling lower, not stabilising. There is also no fresh MA-cross, so there is no new moving-average crossover to suggest a trend reversal is underway.
Price is now sitting in the lower part of its near-term band structure. The 20-hour support at 11,500.00 is close enough to matter, while 20-hour resistance at 13,134.00 remains well overhead. On the current positioning, the stock is at about 24% of that range, which means it is nearer the floor than the ceiling. That usually signals caution: the market is close to a support zone, but it has not yet proved it can climb away from it.
The broader three-month range adds context. The share has traded between 15,126.00 and 9,892.00, so the current level is not in panic territory, but it is clearly away from the upper half of the range where stronger trend confidence tends to appear.
Oscillators & Momentum
Momentum indicators are mixed, but not in a way that argues for strength yet. The RSI(14) at 37.7 is technically neutral, though it is leaning toward the weaker side of the scale. RSI measures whether a stock has been pushed too hard in one direction; here it suggests selling pressure has eased from extreme levels, but buyers have not taken control.
The Stochastic %K at 52.0 and %D at 53.2 are also neutral. Stochastic helps show whether price is closing near the top or bottom of its recent range, and these readings say the stock is neither stretched to the downside nor showing a clean upside breakout signal.
The more important warning comes from MACD. The MACD at -389.496 is below the signal line at -325.408, with a histogram of -64.088. That combination points to negative momentum still dominating the tape. In simple terms, the trend is not just weak; it is still losing ground relative to its recent baseline.
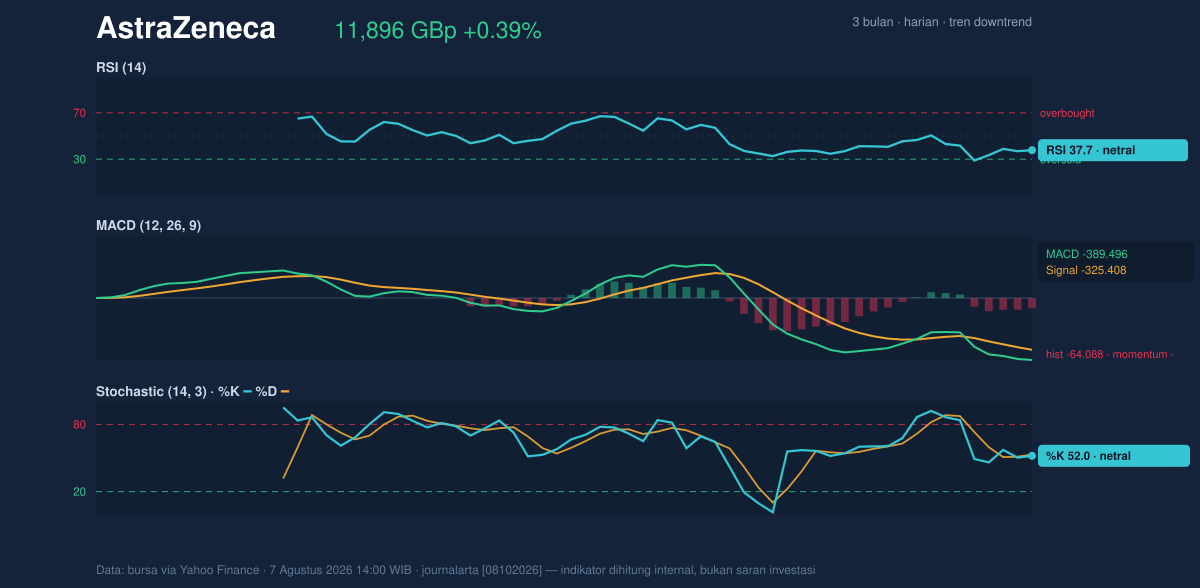
So while the oscillators are not deeply oversold, they are also not confirming a recovery. That mismatch matters. When RSI and Stochastic are neutral but MACD remains negative, it often means the stock is pausing inside a downtrend rather than reversing it.
Volatility & Volume
The Bollinger setup shows price near the lower band. The lower Bollinger band at 11,611.88 sits just below the last price, with %B at 17%. That means the share is trading near the bottom of its recent volatility envelope. This is not automatically bullish; it simply tells readers the stock is priced close to a statistically low point within the recent range. If the lower band holds, it can act as a short-term floor. If it gives way, the move lower can accelerate.
The band width is 13.5%, described as normal, so there is no squeeze suggesting an imminent volatility explosion. But the ATR(14) at 538.79, equal to 4.5% of price, says daily swings remain elevated. ATR, or average true range, is a measure of how much the stock typically moves in a session. A higher reading means stops and support levels can be tested quickly, especially when momentum is already negative.
Volume is the one constructive element. The latest reading of 12,677,978 shares is about 3.0× the 20-session average of 4,246,757, and OBV is rising. OBV, or on-balance volume, tracks whether trading volume is flowing into or out of the stock. Rising OBV alongside a volume surge can mean buyers are showing up on dips, even if price has not yet confirmed a full reversal. That is an important distinction: participation is improving, but price still needs to prove it.
Key Levels & Scenarios
The immediate line in the sand is 11,500.00 support. A sustained break below that area would expose the lower Bollinger band at 11,611.88 as a failed cushion and make the current bounce look more like a pause than a base. On the upside, 12,451.50 — the SMA20 and Bollinger middle band — is the first meaningful hurdle, because reclaiming it would show the stock is moving back toward its recent average rather than drifting below it.
Above that, 13,134.00 resistance is the next test, and the 13,197.96 SMA50 sits just beyond it. That pair matters because a stock that clears both a resistance zone and a medium-term average usually has a better chance of shifting from repair mode into recovery mode.
Technical Verdict: HOLD (wait & see)
HOLD (wait & see)
- Reason 1: price is below the SMA20 and SMA50, and the SMA20 slope is negative, which keeps the trend bearish.
- Reason 2: MACD remains negative with the histogram below zero, so momentum still favours sellers.
- Reason 3: volume is strong and OBV is rising, which suggests accumulation interest is appearing, but not yet enough to reverse the chart.
- Verdict invalidated if price falls below 11,500.00, because that would break the nearest support and weaken the case for a stabilisation phase.
- Ideal Entry Range: 11,611.88 to 12,451.50
- Exit Target: 13,134.00 to 13,197.96
- Stop Loss protection: below 11,500.00
In plain English, the chart says AstraZeneca is trying to stabilise, but the downtrend has not been broken yet.
The latest volume was 12,677,978 shares, versus a 20-session average of 4,246,757.
Summary Data AstraZeneca
| Last price | 11,896.00 GBp |
| Change 1 day / 5 days / 1 month | 0.39% / -5.83% / -7.31% |
| Trend / MA-cross | downtrend / none |
| SMA20 / SMA50 | 12,451.50 / 13,197.96 |
| RSI (14) / Stochastic %K | 37.7 / 52.0 |
| Bollinger %B / ATR | 17% / 538.79 |
| Support / Resistance 20 days | 11,500.00 / 13,134.00 |
| Data as of | 7 Agustus 2026 14:00 WIB |
