RSI Oversold, PEP Stock Gains 0.46% Today
On September 24, 2026: price 130.18 USD, trend downtrend, RSI 28.2, support 129.59, resistance 142.27. technical analysis of pep stock.

PepsiCo slipped to 130.18 USD on Nasdaq, up 0.46% on the day but still down 10.02% over the past month, according to Yahoo Finance data as of 23 September 2026 20:30 WIB. That split matters: the stock is trying to stabilize after a sharp slide, yet the broader tape still says sellers have the upper hand.
Trend & Price Action
The chart shows a stock that is still trading below its short- and medium-term trend lines. PEP is below its SMA20 at 137.05 and also under its SMA50 at 138.29, which means the recovery attempt has not yet reclaimed the levels that typically mark a healthier trend. More importantly, the moving averages have already crossed in a death cross, with the 20-day average cutting below the 50-day average. In plain English, that is a signal that recent weakness has overtaken the longer trend.
The slope of the SMA20 at -1.98% over 5 days reinforces that message: the trend is not merely flat, it is still leaning down. The stock is also sitting near the lower end of its recent range, with the 20-hour support at 129.59 only just below the latest print. That proximity matters because it shows the market is testing whether buyers will defend the area where the last line of support has been drawn.
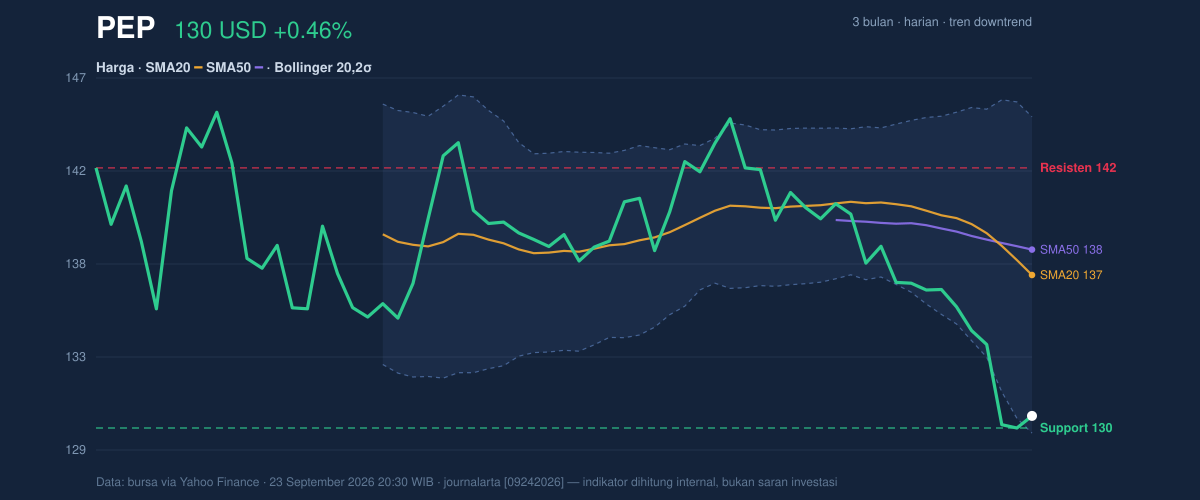
The broader three-month range adds context. PepsiCo is trading above the 3-month low of 127.98 but well below the 3-month high of 149.04. That positioning tells readers the stock is not in a breakdown panic, but it is clearly operating in the lower half of the range, where rallies often need stronger confirmation to stick.
Oscillators & Momentum
The momentum gauges are flashing a different message from the price chart: the stock is stretched to the downside. RSI(14) at 28.2 is in oversold territory, which means the recent selling may have gone far enough to invite short-term bargain hunting. But oversold is not the same as recovered. It only says the decline is becoming extended, not that it has ended.
The stochastic oscillator tells a similar story. %K at 16.0 and %D at 9.8 are both oversold, suggesting the latest swings have been compressed toward the lower end of the range. That often happens when momentum is weak and the market is waiting for a catalyst. The key point is that oversold readings can support a bounce, but they do not override the larger trend unless price action turns first.
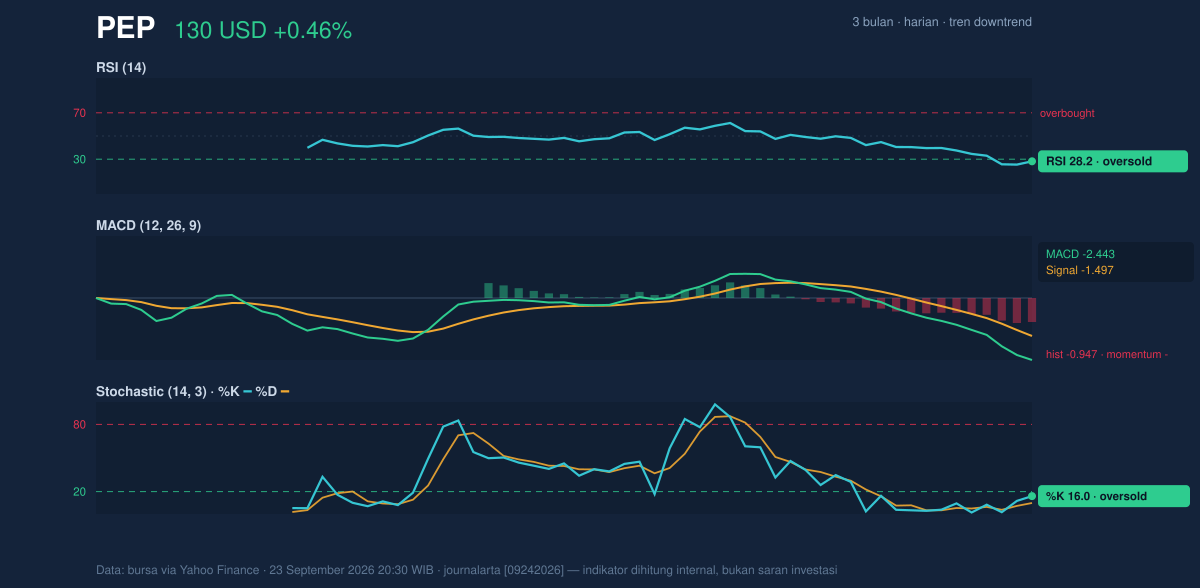
The MACD at -2.443, with the signal line at -1.497 and a negative histogram of -0.947, is the clearest proof that downside momentum remains in place. MACD is a trend-following indicator, and when it is below zero with a negative histogram, it suggests the recent move is still running below the market’s average pace. So while RSI and stochastic hint at exhaustion, MACD says the bears still control the tape.
Volatility & Volume
Volatility is present, but not extreme. The ATR(14) of 2.18, equal to 1.7% of price, suggests the stock is moving enough to matter, but not in a disorderly way. That is important because a moderate ATR often means the next move can still travel meaningfully without requiring a shock in the market.
The Bollinger Bands add another layer. Price is near the lower band, with the lower band at 129.34, the middle band at 137.05, and the upper band at 144.76. The %B at 5% shows the stock is hugging the bottom of its volatility envelope. In simple terms, that means PEP is trading very close to the lower edge of its recent statistical range, which often coincides with either a reflex bounce or a fresh leg lower. The fact that the Bollinger band width is 11.2% and described as normal suggests the market is not in a squeeze that would force an imminent breakout; instead, it is in a regular trading regime where follow-through still depends on price confirmation.
Volume is not giving buyers much help yet. The latest volume of 8,173,400 is only 0.9x the 20-day average of 8,992,195, which means the rebound attempt is happening on slightly subdued participation. When price rises on lighter volume, it often signals hesitation rather than conviction. The OBV is falling, and that matters because On-Balance Volume is a participation measure: a declining OBV implies that trading flow has been net negative even if the stock can occasionally bounce. That weakens the case that a durable reversal is already underway.
Key Levels & Scenarios
The immediate map is straightforward. 129.59 is the nearest support to watch, with the 3-month low at 127.98 sitting just below it as a deeper floor. On the upside, 142.27 is the first resistance that needs to be reclaimed before the chart can begin to repair. Above that, the SMA20 at 137.05 and SMA50 at 138.29 now act as overhead hurdles because the stock is trading below both.
If price can hold above 129.59 and reclaim the lower Bollinger band at 129.34, the chart would at least have room for a short-term rebound toward the middle band at 137.05. If it fails there, the next area of concern is the 127.98 low from the past three months, where the market would be testing whether the recent downtrend is simply a correction or something more persistent.
Technical Verdict: HOLD (wait & see)
HOLD (wait & see)
- RSI at 28.2 and Stochastic %K/%D at 16.0/9.8 show the stock is oversold, so downside may be stretched.
- MACD at -2.443 with a negative histogram still points to active bearish momentum.
- Price below SMA20 137.05 and SMA50 138.29, plus the death cross, keeps the broader trend negative.
Verdict invalidated if price falls below 127.98, the three-month low.
- Ideal Entry Range: 129.34 to 129.59, where the lower Bollinger band and nearby support cluster.
- Exit Target: 137.05 to 142.27, aligned with the Bollinger middle band and first resistance.
- Stop Loss Protection: below 127.98, where the recent range breaks down.
In plain English: PepsiCo looks stretched enough to bounce, but not strong enough yet to prove the decline is over.
“The market is asking whether this is exhaustion or just another pause on the way down.”
Summary Data PEP
| Last price | 130.18 USD |
| Change 1 day / 5 days / 1 month | 0.46% / -3.93% / -10.02% |
| Trend / MA-cross | downtrend / death |
| SMA20 / SMA50 | 137.05 / 138.29 |
| RSI (14) / Stochastic %K | 28.2 / 16.0 |
| Bollinger %B / ATR | 5% / 2.18 |
| Support / Resistance 20 days | 129.59 / 142.27 |
| Data as of | 23 September 2026 20:30 WIB |
