MSFT Stock Gains 0.52%, Momentum Weakens In Focus
On September 24, 2026: price 500.59 USD, trend uptrend, RSI 56.6, support 490.30, resistance 513.53. technical analysis of msft stock. MSFT Stock Gains — full…

Microsoft edged higher on the Nasdaq on 23 September 2026, with MSFT last changing hands at 500.59 USD, up 0.52% from the previous close of 498.00. The move keeps the stock above its near-term trend line, but the tape is sending a mixed message: price is constructive, while momentum has not fully caught up.
Trend & Price Action
As shown in the chart, Microsoft is still trading in an uptrend, with the SMA20 at 499.41 rising at 0.64% over 5 days. That matters because a rising 20-day average usually signals that buyers have been willing to pay progressively higher prices over the last month, not just on one strong session. The stock is also well above the SMA50 at 471.46, which keeps the medium-term structure firmly positive.
The absence of a fresh MA-cross is important. It means the current advance is being sustained by price holding above the shorter average rather than by a new moving-average crossover event. In plain terms, the trend is intact, but it is not being reinforced by a new technical trigger. The share price sits in the upper half of its recent range, at about 44% of the 20-hour range from the low toward the high, which suggests there is room to extend higher, though not yet a clean breakout.
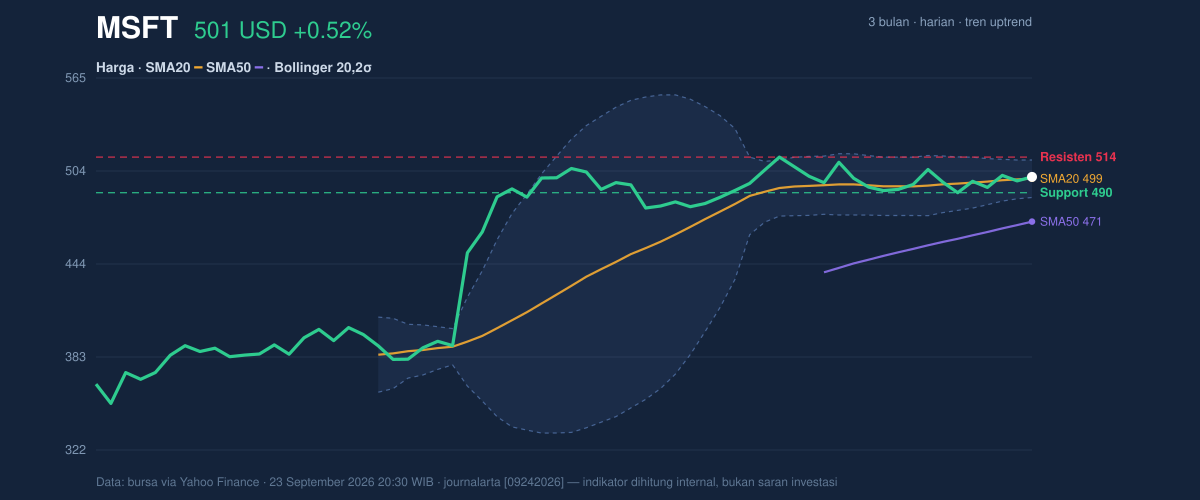
The key near-term map is clear: support at 490.30 and resistance at 513.53. That range frames the next test. A move through the top of that band would show buyers are able to absorb supply near recent highs; a slide back toward support would imply the market is still deciding whether this is a steady climb or just a pause within a larger advance.
Oscillators & Momentum
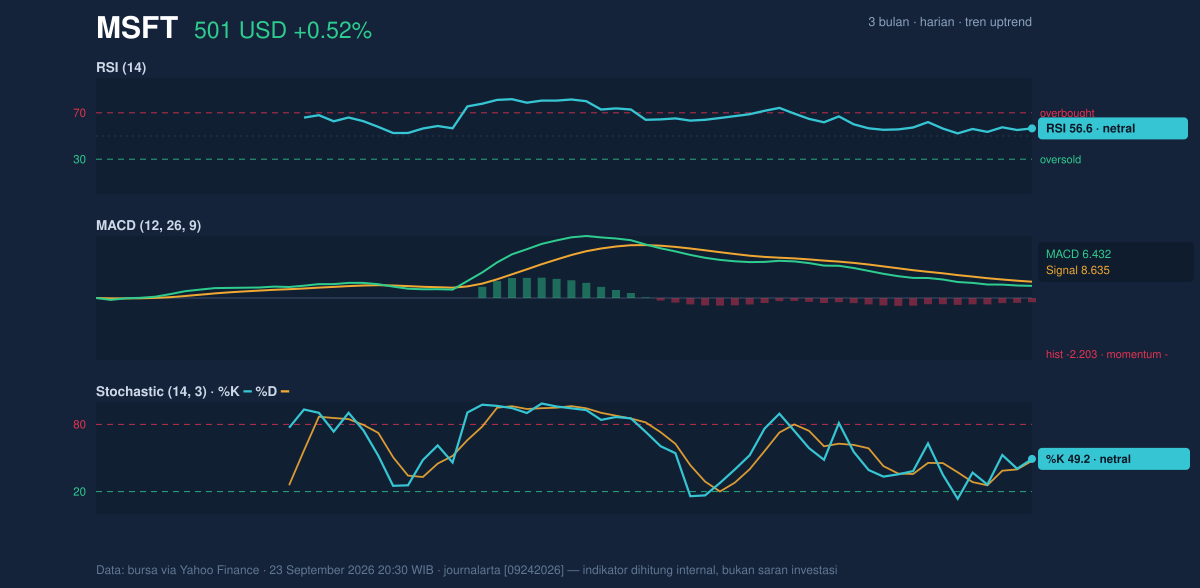
Momentum is more restrained than the price action suggests. The RSI at 56.6 is neutral-to-positive, which means the stock is not stretched into an overbought condition and still has some technical breathing room. The Stochastic %K at 49.2 and %D at 47.4 are also neutral, showing neither a strong short-term thrust nor an oversold bounce setup. In other words, the oscillators are not warning of exhaustion, but they are also not yet confirming acceleration.
The clearest caution comes from MACD. With MACD at 6.432 below the signal line at 8.635 and a histogram of -2.203, the short-term momentum trend is still negative. For readers less familiar with the term, the histogram measures the gap between the MACD line and its signal line; a negative reading means momentum is lagging price. That divergence matters because it often shows up when a stock is rising, but not with enough force to suggest a decisive breakout yet.
This is the central tension in the chart: price is above trend, but momentum has not fully synchronized with it. That does not automatically imply weakness. It does mean the current advance is more vulnerable to stalling if buyers fail to generate follow-through near resistance.
Volatility & Volume
Volatility is moderate, not explosive. The ATR at 10.87, equal to 2.2% of price, suggests a normal daily trading range for a large-cap name rather than a disorderly swing. More interesting is the Bollinger setup. The bands are relatively tight, with a 4.9% width, and that narrowing points to a squeeze — a period when volatility compresses before a larger directional move. The stock is trading near the middle of the band structure, with %B at 55%, which indicates price is slightly above the midpoint rather than pressing the upper band.
That combination is important: a squeeze does not tell you direction, only that the market may be storing energy. If price starts leaning toward the upper band at 511.63, the chart would begin to favor continuation. If it slips back toward the lower band at 487.19, the squeeze would instead be resolving lower.
Volume is not providing a strong confirmation signal yet. Last volume was 19,415,500, below the 20-hour average of 21,542,235, or about 0.9x normal. That means the latest gain came on lighter-than-average participation, which limits the strength of the move. Still, OBV is rising, and that is a constructive background signal because on-balance volume tracks whether money flow is broadly accumulating over time. In simple terms, the market is not rejecting the advance, even if it has not fully embraced it on the latest session.
Key Levels & Scenarios
The chart’s near-term structure is built around the same three anchors: 490.30 support, 499.41 SMA20, and 513.53 resistance. With the stock above the 20-day average and the Bollinger bands tightening, the most meaningful question is whether Microsoft can convert a neutral momentum backdrop into a range break.
If 513.53 gives way with improving participation, the stock would be signaling that the current squeeze is resolving higher. If price instead loses 499.41 and then 490.30, the market would be telling us that the recent advance has lost traction and that the lower band at 487.19 is no longer just a statistical boundary but a real test of demand.
The broader backdrop still matters. Microsoft remains far above its 3-month low of 349.20 and only modestly below its 3-month high of 517.78, which places the current trade near the upper end of the recent three-month box. That positioning usually means the market is no longer pricing in deep pessimism; it is instead asking whether the next leg can justify fresh highs.
Technical Verdict: HOLD (wait & see)
HOLD (wait & see)
- Reason 1: Price is above the SMA20 at 499.41 and well above the SMA50 at 471.46, keeping the trend constructive.
- Reason 2: MACD is below its signal line with a -2.203 histogram, showing momentum is still lagging the price.
- Reason 3: The Bollinger bands are squeezing and volume is only 0.9x normal, so the market has not yet confirmed a decisive expansion move.
- Verdict invalidated if price falls below 490.30, because that would break near-term support and weaken the current uptrend structure.
- Ideal Entry Range: 499.41 to 500.59
- Exit Target (Target Price): 513.53, then 511.63 as the upper Bollinger band reference
- Stop Loss protection: 490.30, with 487.19 as the lower Bollinger band backstop
For non-traders: the stock still looks healthy, but the chart is asking for proof before the next move. “We need to see whether buyers can finally push through resistance,” one market participant might say, and that is where the real stakes now sit.
Summary Data MSFT
| Last price | 500.59 USD |
| Change 1 day / 5 days / 1 month | 0.52% / 2.10% / 1.81% |
| Trend / MA-cross | uptrend / none |
| SMA20 / SMA50 | 499.41 / 471.46 |
| RSI (14) / Stochastic %K | 56.6 / 49.2 |
| Bollinger %B / ATR | 55% / 10.87 |
| Support / Resistance 20 days | 490.30 / 513.53 |
| Data as of | 23 September 2026 20:30 WIB |
