COST Stock Gains 0.69% Today, Testing Support Level
On September 24, 2026: price 904.70 USD, trend downtrend, RSI 41.6, support 893.74, resistance 960.01. technical analysis of cost stock.

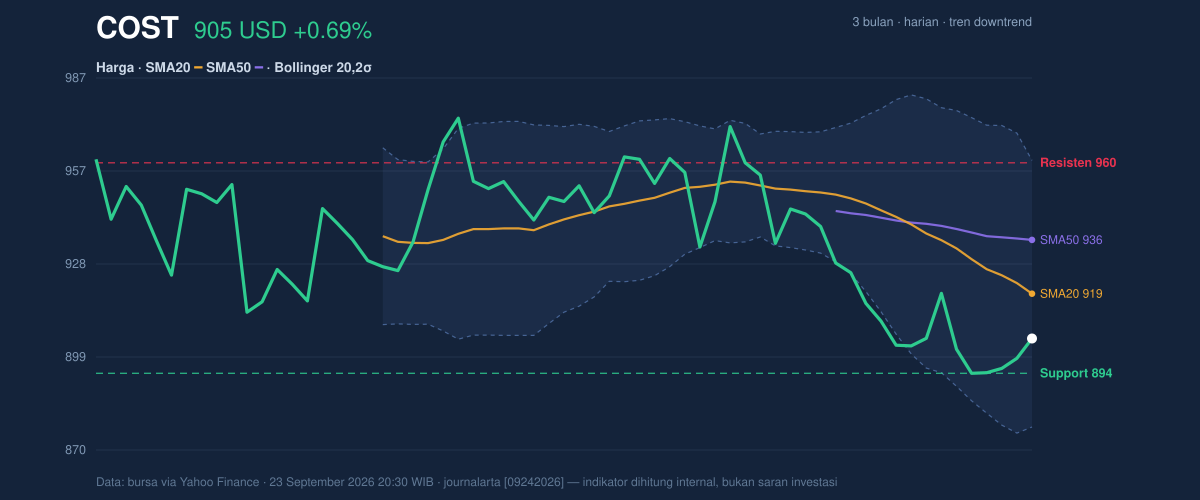
Costco Wholesale Corp. fell to 904.70 USD on Nasdaq on 23 September 2026, holding just above recent support even as the broader price structure stayed tilted lower, with the shares still trading below both the SMA20 at 918.80 and the SMA50 at 935.75. The move matters because it shows a stock that is not breaking down sharply, but is also not yet reclaiming the short-term trend line that would signal buyers are regaining control.
Trend & Price Action
The chart shows Costco remains in a downtrend, with the SMA20 sloping down 1.53% over the past 5 days. That slope is important: a falling short-term average usually means recent rallies are being sold into before they can develop into a sustained rebound. The lack of a new MA-cross also matters. In plain terms, there is no fresh moving-average crossover to suggest a new trend regime has begun; the stock is still working through the prior weakness rather than escaping it.
The shares are also sitting in the lower half of their recent range. With the 20-hour support at 893.74 and resistance at 960.01, the last price is only about 17% up from the floor of that band, which tells readers the market is closer to defense than expansion. The 3-month high of 987.55 and 3-month low of 885.50 frame the bigger picture: Costco has bounced off the lows, but it has not yet reclaimed the upper part of the range where stronger momentum would usually be visible.
A close above the mid-band would be the first sign that sellers are losing their grip.
Until then, the chart says “repair,” not “reversal.”
Oscillators & Momentum
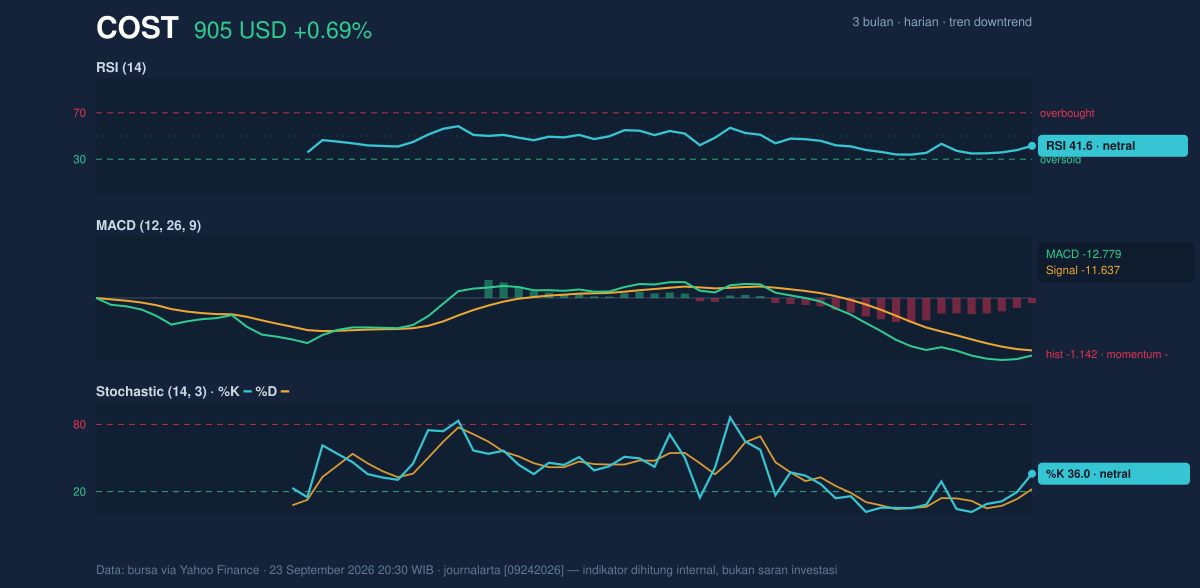
The momentum picture is mixed, but not bullish enough to override the trend. The RSI at 41.6 is neutral, which means the stock is neither stretched to the downside nor showing the kind of overbought condition that often precedes a pullback. That is a useful signal because it suggests the recent weakness is not yet extreme; there is still room for price to move either way without immediately hitting an exhaustion zone.
The Stochastic %K at 36.0 and %D at 22.3 also read as neutral, but the gap between the two lines indicates the short-term bounce has not fully matured into stronger upside confirmation. Stochastic is often used to gauge whether price is near the top or bottom of its recent trading band; here, it says Costco is recovering from a softer patch, but not with enough force to call the move decisive.
The clearest message comes from the MACD at -12.779, with the signal line at -11.637 and a histogram of -1.142. MACD below zero means the trend still carries negative momentum, and the negative histogram shows that the MACD line remains below its signal line. In practical terms, the stock may be stabilizing, but the underlying momentum has not yet turned positive.
That is the difference between a pause and a breakout.
Right now, Costco is still pausing.
Volatility & Volume
Volatility is subdued. The ATR(14) of 12.64, equal to 1.4% of price, suggests daily swings are relatively contained. Lower ATR often means the market is waiting for a catalyst or digesting prior moves, and that fits with the current setup: the stock is not in a panic phase, but neither is it showing the kind of wide-range expansion that usually accompanies a forceful trend change.
Bollinger Bands reinforce that reading. The upper band is 960.75, the middle band is 918.80, and the lower band is 876.86, with %B at 33% and band width at 9.1%, described here as normal. A %B reading near one-third of the band means price is sitting in the lower portion of its recent volatility envelope, but not at an extreme. That matters because it implies Costco is closer to the downside boundary than the upside boundary, yet still has room to move either way before volatility becomes stretched.
Volume adds a more constructive note. The latest volume of 2,280,700 was about 1.1x normal versus the 20-day average of 2,088,875, and OBV is rising. OBV, or on-balance volume, tracks whether trading flow is generally accumulating or distributing. A rising OBV while price is still under pressure often means buyers are quietly participating even before the chart fully confirms it. That is not a breakout signal on its own, but it does reduce the odds that every bounce is being met only with selling.
Key Levels & Scenarios
The immediate technical map is clear. Support at 893.74 is the first line to watch, and the lower Bollinger band at 876.86 sits just beneath it as the next meaningful floor. On the upside, resistance at 960.01 aligns closely with the Bollinger upper band at 960.75, making that zone the first real test of whether the stock can convert a rebound into something stronger. The SMA20 at 918.80 is the near-term pivot: reclaiming it would indicate the stock is at least trying to reverse the short-term drift.
If Costco holds above 893.74 and pushes back through 918.80, the chart would begin to favor a firmer recovery toward 960.01. If it fails to hold 893.74, the lower band at 876.86 becomes the next area where buyers would need to show up quickly.
Technical Verdict: HOLD (wait & see)
HOLD (wait & see) — the setup is stabilizing, but not yet strong enough to call a clean trend reversal.
- MACD remains negative, so downside momentum has not fully cleared.
- Price is below the SMA20 and SMA50, which keeps the short-term trend under pressure.
- OBV is rising and volume is modestly above average, which hints that buyers are still present even while price lags.
Verdict invalidated if price breaks below 893.74.
- Ideal Entry Range: 893.74 to 918.80
- Exit Target: 960.01 to 960.75
- Stop Loss protection: below 876.86
In plain English: Costco is trying to steady itself, but the chart still needs proof before the balance shifts back to the upside.
The 20-hour resistance stands at 960.01.
Summary Data COST
| Last price | 904.70 USD |
| Change 1 day / 5 days / 1 month | 0.69% / 0.37% / -6.87% |
| Trend / MA-cross | downtrend / none |
| SMA20 / SMA50 | 918.80 / 935.75 |
| RSI (14) / Stochastic %K | 41.6 / 36.0 |
| Bollinger %B / ATR | 33% / 12.64 |
| Support / Resistance 20 days | 893.74 / 960.01 |
| Data as of | 23 September 2026 20:30 WIB |
