BP Stock Technicals Today: Drops 0.48%, Momentum Weakens
On Agustus 10, 2026: price 517.20 GBp, trend sideways, RSI 48.0, support 505.00, resistance 555.90. technical analysis of bp stock. BP Stock Technicals — full…
By Alistair Sterling
August 10, 20265 min read
BP Stock Technicals Today: Drops 0.48%, Momentum Weakens
BP plc is trading in a narrow but telling band on the London market: the shares are below their short-term average, momentum is soft, and the recent jump in trading volume has not yet translated into a clean upside break.
As shown by data from the London exchange via Yahoo Finance at 7 August 2026 14:00 WIB, BP.L last traded at 517.20 GBp, down 0.48% on the day after a 6.39% drop over five days, even though the shares are still 7.16% higher over one month. That mix matters. It says the stock has not lost its longer short-term recovery entirely, but the latest move shows sellers are still willing to lean on rallies.
Trend & Price Action
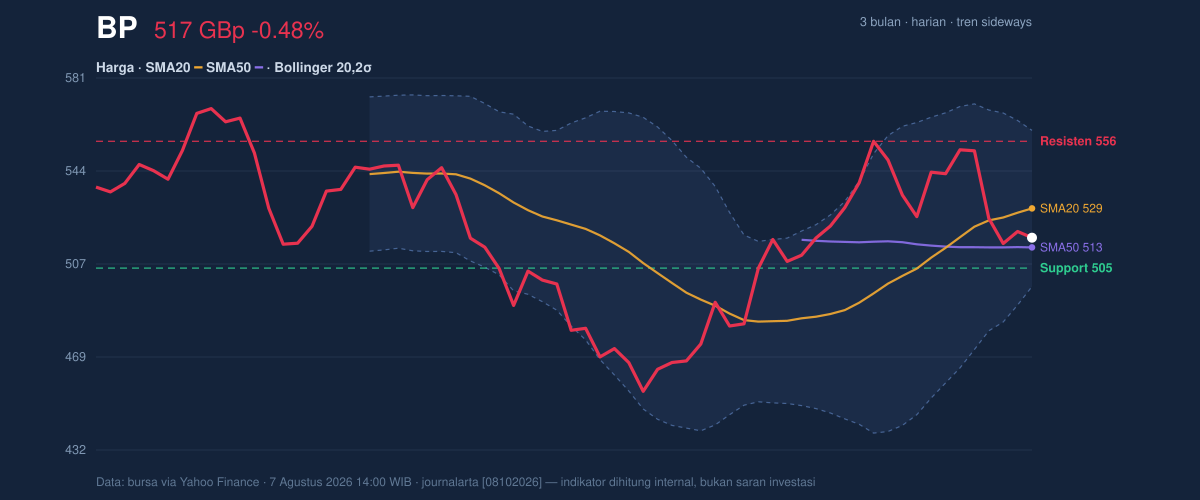
The chart places BP in a sideways trend, not a strong directional phase. That is reinforced by the fact that price is below SMA20 at 528.96 but above SMA50 at 513.34. In plain terms, the stock is sitting between its faster and slower trend gauges: short-term momentum has weakened, but the medium-term structure has not fully broken.
The slope of the SMA20 at 2.23% over 5 days still points upward, which means the trend line itself has not rolled over decisively. But because there is no fresh MA-cross, the market is not receiving a strong trend-confirmation signal. That absence is important: when moving averages do not cross, traders often read the setup as indecisive rather than trending.
3-month price action chart of BP: price, SMA20/50, Bollinger, support & resistance. Data: exchange via Yahoo Finance.
The Bollinger bands add another layer. BP is trading near the lower half of the band structure, with %B at 31% and the price sitting closer to the lower band at 497.63 than the upper band at 560.28. The bands are described as normal in width at 11.8%, so this is not a compression setup screaming for a breakout, nor an extreme volatility event. It is a balanced range, and the market is still deciding whether to defend the lower half or rotate back toward the middle band at 528.96.
Oscillators & Momentum
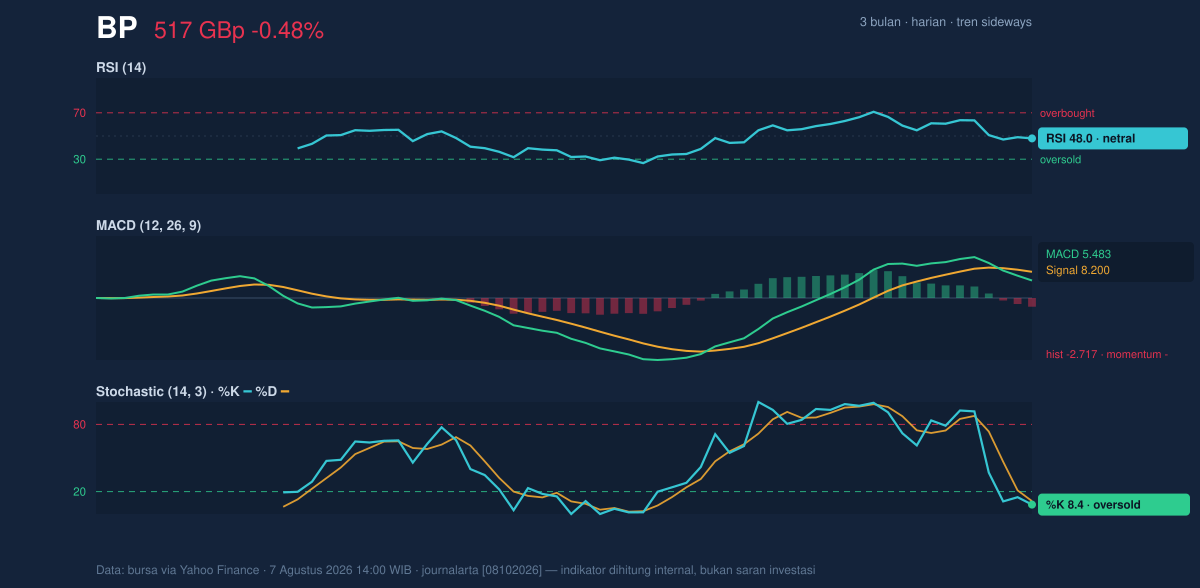
Momentum chart of BP: RSI(14), MACD, Stochastic. Data: exchange via Yahoo Finance.
The momentum picture is mixed, and that is the key signal. RSI at 48.0 is neutral, which means BP is neither overbought nor oversold on that measure. But the stochastic oscillator tells a different story: %K at 8.4 and %D at 11.6 are both in oversold territory. That usually means recent selling has pushed the stock toward the lower end of its short-term range, even if the broader momentum gauge has not yet flipped into a full reversal signal.
The MACD side is more cautious. MACD at 5.483 remains below the signal line at 8.200, with a -2.717 histogram. That combination means downside momentum is still ahead of upside momentum. In practical terms, the stock can bounce from oversold conditions, but the trend-following indicator has not yet confirmed that the bounce is becoming a sustained recovery.
This is where the chart matters as a narrative rather than a decoration: oversold stochastic readings often show pressure has become stretched, but a negative MACD warns that any rebound may still face overhead supply.
Volatility & Volume
Volatility is moderate. ATR at 16.71, or 3.2% of price, suggests BP has enough daily movement to test nearby levels without implying disorderly trading. That matters because a stock with moderate ATR can often move from support to resistance quickly if buyers or sellers regain control.
Volume is the more striking feature. The latest session printed 129,847,104 shares versus a 20-session average of 47,705,270, or 2.7× normal turnover. Heavy volume during a decline can mean distribution — institutions or larger holders are exiting into strength or weakness. That interpretation is supported by the fact that OBV is falling. OBV, or on-balance volume, tracks whether trading volume is accumulating on up days or down days; a falling line generally says the market is not yet seeing sustained buying pressure.
In other words, the volume spike is not automatically bullish. It shows participation, but the direction of that participation still looks cautious.
Key Levels & Scenarios
The most relevant near-term map is clear. Support at 505.00 is the first line the market is likely to defend, while resistance at 555.90 is the ceiling that has to be reclaimed for a stronger technical tone. BP is currently sitting in the lower quarter of that range, at 24% of the 20-session band.
The broader context is equally useful: the 3-month high is 575.70 and the 3-month low is 450.60. That places the current price well above the recent floor but still notably below the upper end of the quarter’s range. So the stock is not in breakdown territory, but it is also not close to reclaiming the upper boundary.
If 505.00 fails, the chart would likely shift toward a retest of the lower Bollinger band at 497.63, with the 3-month low at 450.60 becoming the broader reference point. If price can move back above 528.96 and then challenge 555.90, the tone improves because that would put BP back above the middle band and the short-term average at the same time.
Technical Verdict: HOLD (wait & see)
HOLD (wait & see) fits the current setup because the indicators are not aligned strongly enough for a directional call.
- RSI at 48.0 is neutral, so it does not confirm a strong trend either way.
- Stochastic at 8.4 / 11.6 is oversold, which hints at a possible rebound, but
- MACD at 5.483 below signal 8.200 and a -2.717 histogram still point to negative momentum.
- Price below SMA20 at 528.96 keeps short-term pressure in place, while OBV falling warns that volume is not yet backing a durable recovery.
Verdict invalidated if price breaks below 505.00, because that would put the lower support and the lower band under direct pressure.
- Ideal Entry Range: 505.00 to 517.20 GBp
- Exit Target (Target Price): 528.96 GBp, then 555.90 GBp
- Stop Loss protection: below 497.63 GBp
In plain English: BP looks stretched enough for a bounce, but not yet strong enough to prove that the bounce will last.
The next important test is whether the shares can hold 505.00 after this week’s 2.7× volume surge.