HSBC Momentum Weakens: Stock Gains 0.53% (Agustus 10, 2026)
On Agustus 10, 2026: price 1,529.20 GBp, trend uptrend, RSI 53.7, support 1,462.00, resistance 1,597.40. technical analysis of hsbc stock.

HSBC Holdings ended at 1,529.20 GBp on the LSE, up 0.53% on the day and sitting almost exactly on its SMA20 at 1,529.11, a level that often acts as a short-term balance point between buyers and sellers. The broader message from the chart is more nuanced than the flat daily move suggests: the share price remains in an uptrend, but momentum indicators are no longer fully in sync, with the MACD turning negative even as the price holds above both short- and medium-term averages. That combination usually signals a market that is still constructive, but no longer moving with the same conviction as before.
Trend & Price Action
The price structure is still technically supportive. HSBC is trading above the SMA20 and well above the SMA50 at 1,459.13, which tells us the medium-term trend remains intact and the recent pullback has not yet damaged the broader upward pattern. The SMA20 slope of 1.47% over 5 days reinforces that the short-term trend is still rising, even if the latest five-day performance of -2.97% shows some near-term giveback. In plain terms, the shares are still climbing the staircase, but they have paused on one of the steps.
The stock is also trading near the middle of its recent range, with 3-month high at 1,610.00 and 3-month low at 1,267.20. That position matters because it suggests HSBC is neither stretched at the top of the band nor under pressure at the bottom. It is closer to equilibrium, where the next move often depends on whether buyers can defend the short-term base and force a retest of the upper range.
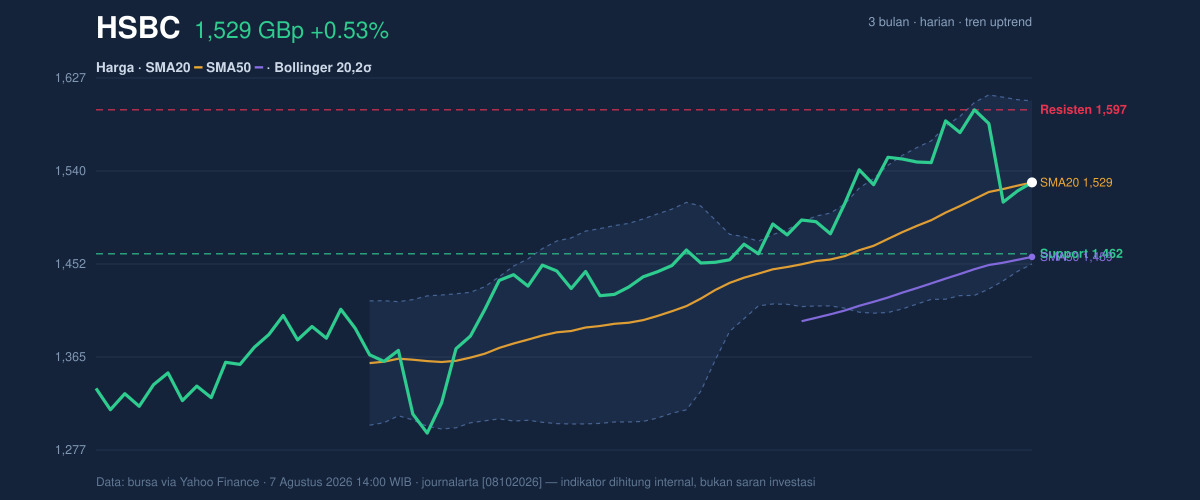
As shown in the chart, the most immediate reference point is the 20-hour support at 1,462.00 and the 20-hour resistance at 1,597.40. Price is sitting around the midpoint of that band, which means the market has not yet chosen a direction for the next leg. A push through resistance would reopen the path toward the recent high, while a loss of support would suggest the current consolidation is more than just a pause.
Oscillators & Momentum
The momentum picture is mixed rather than bullish. The RSI at 53.7 is neutral, which means HSBC is not overbought and not oversold — there is still room for the stock to move either way without immediately running into a technical extreme. The Stochastic %K at 40.2 and %D at 45.5 also sit in neutral territory, but they lean slightly softer, indicating that short-term price pressure has eased from earlier strength. In other words, momentum is not flashing a reversal signal, but it is no longer confirming the trend with enthusiasm.
The more important warning sign is the MACD at 25.848 below its signal line at 32.223, with a histogram of -6.375. That negative histogram means the recent pace of gains has slowed enough for downside momentum to overtake upside momentum in the near term. This does not automatically mean the trend has broken, but it does mean the rally is less forceful than the price alone might imply. For traders reading the chart, that is often the first sign of a consolidation phase rather than a fresh breakout.
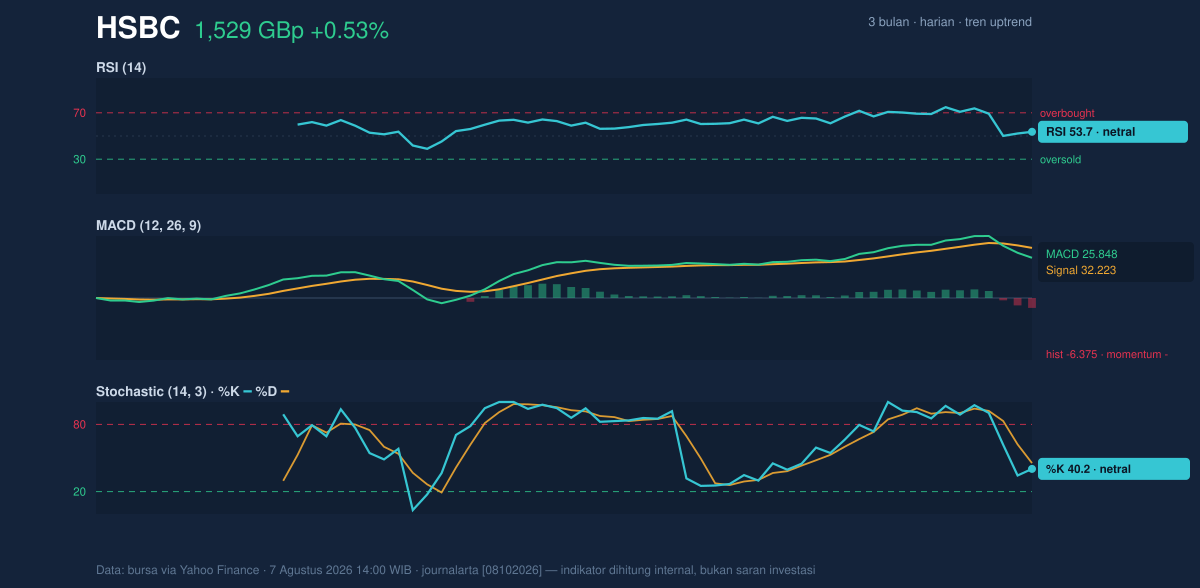
As shown in the momentum chart, the key signal is not that HSBC is weak — it is that momentum is lagging price. When RSI and Stochastic are neutral but MACD turns negative, the market is usually telling us that buyers remain present, yet they are not pressing aggressively enough to extend the move immediately.
Volatility & Volume
Volatility is contained for now. The Bollinger Bands are normal, with the upper band at 1,605.80, the middle band at 1,529.11, and the lower band at 1,452.42. A %B of 50% places the share price right in the middle of the band, which usually signals a balanced market rather than an overextended one. The 10.0% band width also points to a standard, not compressed or explosive, setup. That matters because a tight squeeze often precedes a sharp move, while a normal band width suggests the market is still digesting information rather than preparing for a sudden volatility burst.
Volume, however, is more striking. The latest reading of 100,547,660 is about 3.7× the 20-day average of 27,103,394, showing that the latest session drew far more participation than usual. Heavy volume can validate a move, but here the OBV is falling, which means the cumulative flow of volume has not been confirming price strength. That divergence matters: it suggests the recent trading burst may not have been driven by steady accumulation. Instead, it looks more like active two-way trading, with supply still showing up whenever the share price tries to extend higher.
Key Levels & Scenarios
The chart levels are clear. 1,462.00 is the first level that matters on the downside, because it marks the lower edge of the recent trading band. If HSBC holds above that area, the uptrend can remain technically intact. Above the market, 1,597.40 is the immediate ceiling; a sustained move through that level would put the 1,605.80 Bollinger upper band and then the 3-month high of 1,610.00 back in focus. The fact that price is currently near the center of the range means neither side has yet taken control.
One useful way to read the setup is this: if HSBC keeps closing above the SMA20 at 1,529.11, the short-term structure remains constructive; if it slips back toward 1,462.00, the market is likely testing whether the recent uptrend has enough depth to absorb selling pressure. The current technical picture is therefore less about trend direction and more about whether the stock can rebuild momentum from a neutral base.
Technical Verdict: HOLD (wait & see)
- Reason 1: The price remains above the SMA20 and SMA50, and the SMA20 slope is still rising, which keeps the broader trend constructive.
- Reason 2: RSI at 53.7 and Stochastic at 40.2 / 45.5 are neutral, while MACD is below signal and the histogram is negative, showing momentum is not yet confirming a fresh advance.
- Reason 3: Volume is 3.7× average but OBV is falling, a divergence that weakens the quality of the latest move.
- Verdict invalidated if price breaks below 1,462.00, because that would damage the current range support and challenge the uptrend structure.
- Ideal Entry Range: 1,462.00 to 1,529.11
- Exit Target (Target Price): 1,597.40 to 1,605.80
- Stop Loss protection: below 1,452.42
In plain English: HSBC still looks technically steady, but the chart is waiting for momentum to prove the price can keep rising.
Volume last session: 100,547,660 shares versus a 20-day average of 27,103,394.
Summary Data HSBC
| Last price | 1,529.20 GBp |
| Change 1 day / 5 days / 1 month | 0.53% / -2.97% / 3.96% |
| Trend / MA-cross | uptrend / none |
| SMA20 / SMA50 | 1,529.11 / 1,459.13 |
| RSI (14) / Stochastic %K | 53.7 / 40.2 |
| Bollinger %B / ATR | 50% / 38.20 |
| Support / Resistance 20 days | 1,462.00 / 1,597.40 |
| Data as of | 7 Agustus 2026 14:00 WIB |

