TSLA Stock Analysis: Gains 2.83%, Momentum Gains
On Agustus 10, 2026: price 328.58 USD, trend downtrend, RSI 41.3, support 298.32, resistance 396.18. technical analysis of tsla stock. TSLA Stock Analysis —…

Tesla shares on NASDAQ rose 2.83% to 328.58 on Thursday, according to Yahoo Finance data cited by the exchange feed, but the move leaves the stock still below its short-term trend line and well inside a broader downtrend. The session gain matters less as a standalone bounce than as a test of whether buyers can keep price above the lower end of the recent range after a 5.58% rise over five days and a 19.42% slide over one month.
Trend & Price Action
The chart shows a stock that is still trading with a defensive tone. TSLA is below its SMA20 at 343.33 and far below its SMA50 at 380.44, which means the rebound has not yet repaired the damage done by the recent selloff. In plain terms, the short-term average is falling faster than price can recover, and that is the classic footprint of a downtrend rather than a fresh uptrend.
There is no new moving-average crossover to point to a shift in regime. That matters because a new cross often signals that recent price strength is starting to overwhelm older weakness; here, the absence of that signal suggests the market is still digesting the prior decline rather than reversing it. The SMA20 slope of -5.66% over five days reinforces that message: sellers have had the upper hand recently, even if they are no longer pressing as aggressively as before.
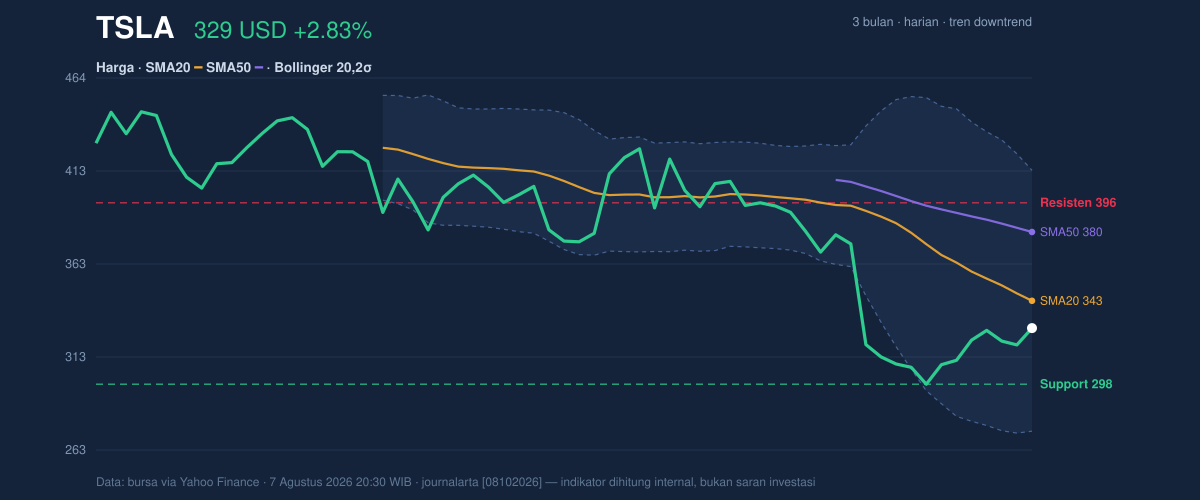
Price is sitting at about 31% of the 20-hour range, which places it closer to the lower end than the middle. That positioning is important because it shows the bounce has not yet reclaimed the range’s center of gravity. The stock is also still above the 20-hour support at 298.32, and that level is now the key line separating a weak consolidation from a deeper break.
Oscillators & Momentum
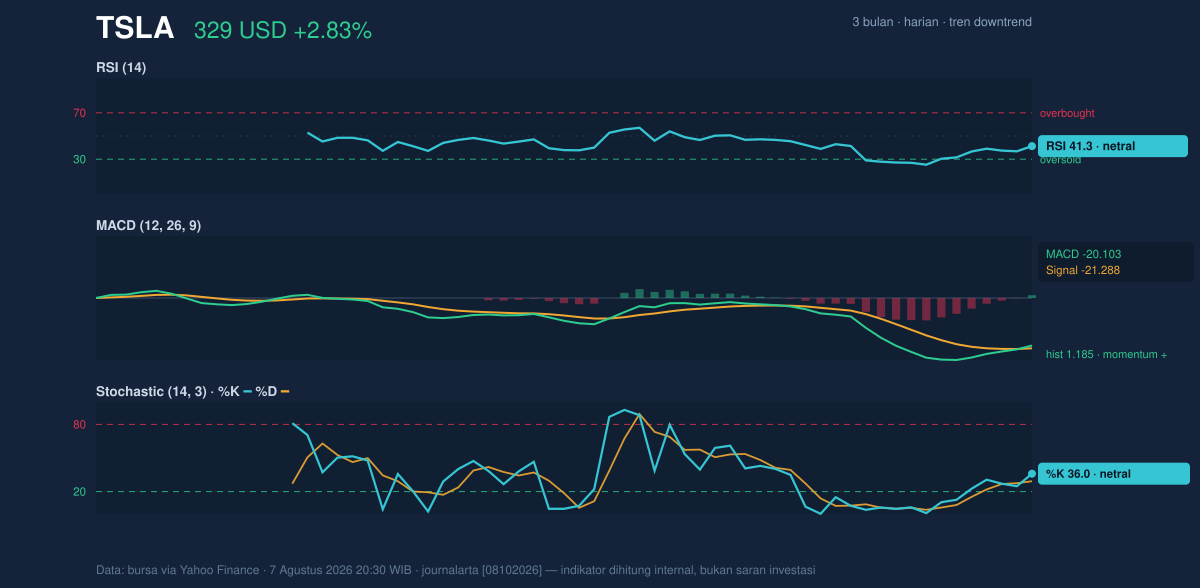
The momentum picture is mixed rather than clearly bullish or bearish. RSI(14) at 41.3 is neutral, but it sits below the midpoint that many traders watch as a rough dividing line between weak and strong momentum. In practical terms, that means the stock is not oversold enough to scream panic, yet it is also not showing the kind of momentum usually seen in a sustained recovery.
The Stochastic %K at 36.0 and %D at 29.3 are also neutral, but with %K above %D, the short-term momentum has improved modestly. That setup often reflects a rebound attempt rather than a confirmed trend turn. It is a signal of traction, not conviction.
The cleaner message comes from MACD. MACD at -20.103 remains below zero, which means the broader momentum trend is still negative, but the histogram at 1.185 is positive and the MACD line is above the signal line at -21.288. In simple terms, the stock is still in a bearish momentum regime, but the rate of decline has slowed enough to create a short-term positive inflection. That is why the chart looks less fragile than the trend line alone would suggest.
Volatility & Volume
The Bollinger Bands show a market that is not calm. The band width is 41.0%, described in the data as expanding, which signals elevated volatility. Expanding bands usually mean the stock has recently been moving with force and may continue to do so; they do not tell direction by themselves, but they do warn that price swings can remain sharp.
The price is below the Bollinger middle band at 343.33 and well beneath the upper band at 413.72, while the lower band sits at 272.94. With %B at 40%, TSLA is inside the lower half of the band structure, which fits a stock that has bounced but has not yet regained balance. In practical language: the market is still giving the benefit of the doubt to downside risk, even after the latest uptick.
Volume does not yet confirm a major shift. Last volume was 39,370,100, almost exactly in line with the 39,385,860 20-hour average, or 1.0x normal. That means the move higher was not backed by a clear surge in participation. The OBV is rising, which is constructive because it suggests accumulation has been improving over time, but without a volume spike the latest rally still looks more like a test than a breakout.
ATR adds another warning. ATR(14) at 14.94, equal to 4.5% of price, points to high day-to-day movement. That is a reminder that TSLA can travel quickly in either direction from here, especially while it remains below the main moving averages.
Key Levels & Scenarios
The immediate map is straightforward. Support at 298.32 is the first level that matters if the rebound fades, while resistance at 396.18 is the first major ceiling to clear before the stock can argue that the recent downtrend is easing. The 3-month low at 297.38 sits just under support, which makes the lower boundary especially sensitive: a break there would put the stock back near the recent floor rather than in a healthy consolidation.
If price can continue to hold above 298.32 and work back toward the 343.33 middle band and SMA20, the chart would start to look less damaged. If it fails there, the market is likely signaling that the bounce was only short covering rather than fresh demand. A push through 396.18 would be more meaningful because it would take TSLA back above the upper part of the recent range and closer to the 50-day average at 380.44.
Technical Verdict: HOLD (wait & see)
HOLD (wait & see)
- Below SMA20 and SMA50: price remains under both key moving averages, so the broader trend is still negative.
- MACD is improving but still below zero: that shows momentum is healing, not yet fully reversed.
- Volume is only 1.0x normal: the rebound lacks the participation usually needed to confirm a durable turn.
Verdict invalidated if price falls below 298.32, because that would break the nearest support and threaten the recent 3-month low area at 297.38.
- Ideal Entry Range: 298.32 to 343.33
- Exit Target: 380.44 to 396.18
- Stop Loss protection: below 297.38
For non-traders, this means Tesla is bouncing, but the chart still needs stronger proof that the fall has ended.
Summary Data TSLA
| Last price | 328.58 USD |
| Change 1 day / 5 days / 1 month | 2.83% / 5.58% / -19.42% |
| Trend / MA-cross | downtrend / none |
| SMA20 / SMA50 | 343.33 / 380.44 |
| RSI (14) / Stochastic %K | 41.3 / 36.0 |
| Bollinger %B / ATR | 40% / 14.94 |
| Support / Resistance 20 days | 298.32 / 396.18 |
| Data as of | 7 Agustus 2026 20:30 WIB |

