AstraZeneca Stock Technicals Today: Drops 1.15%, Momentum Weakens
On Agustus 14, 2026: price 11,708.00 GBp, trend downtrend, RSI 35.8, support 11,500.00, resistance 13,134.00. technical analysis of astrazeneca stock.

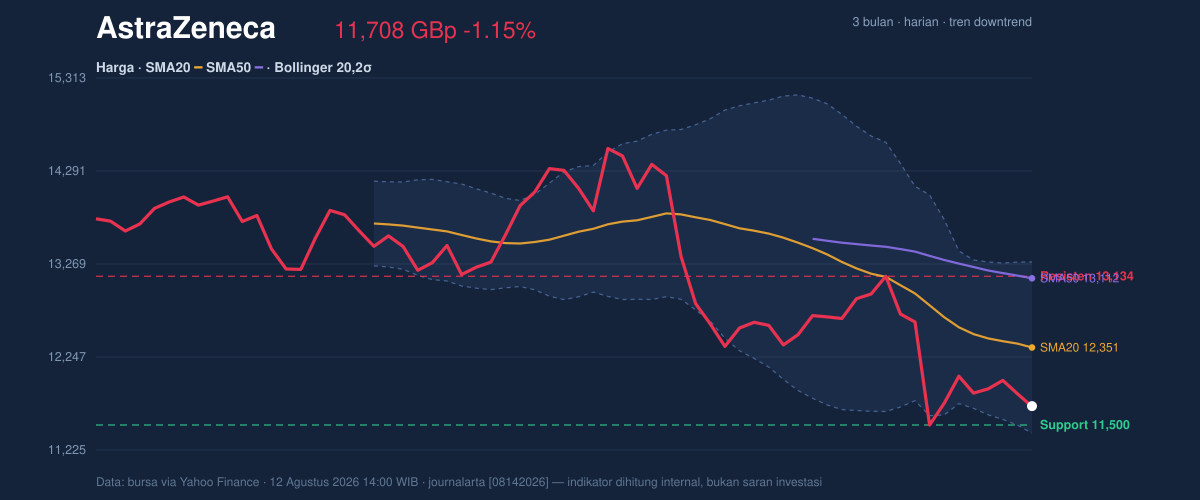
According to data from Yahoo Finance on 12 August 2026 at 14:00 WIB, AstraZeneca’s LSE-listed shares last traded at 11,708.00 GBp, extending a short-term slide that has left the stock below its 20-day and 50-day moving averages. The move matters because it shows price is still trading under the market’s recent average, while momentum gauges are split: trend remains weak, but some short-term oversold readings suggest the selling may be losing some force rather than accelerating.
Trend & Price Action
The broader picture is still negative. AstraZeneca is in a downtrend, with the SMA20 at 12,351.30 sitting above the share price and the SMA50 at 13,111.52 even higher. That arrangement tells investors the stock has not only lost its near-term footing, but is also trading well below a longer reference point that many market participants use to judge whether a move is healthy or broken. In plain terms, the chart is not showing a stock merely pausing; it is showing one that has been under persistent pressure.
The slope of the SMA20 is -1.77% over 5 days, which confirms the short-term trend is still pointing lower. There is also no fresh MA-cross, meaning the market has not yet produced a new moving-average crossover signal that would normally hint at a more decisive shift in direction. As shown in the chart, price is sitting in the lower part of its recent range, with the 20-hour support at 11,500.00 close enough to matter immediately and the 20-hour resistance at 13,134.00 still far overhead. The stock is also only 13% through the range, which suggests it is nearer the lower end of its recent trading band than the upper end.
Oscillators & Momentum
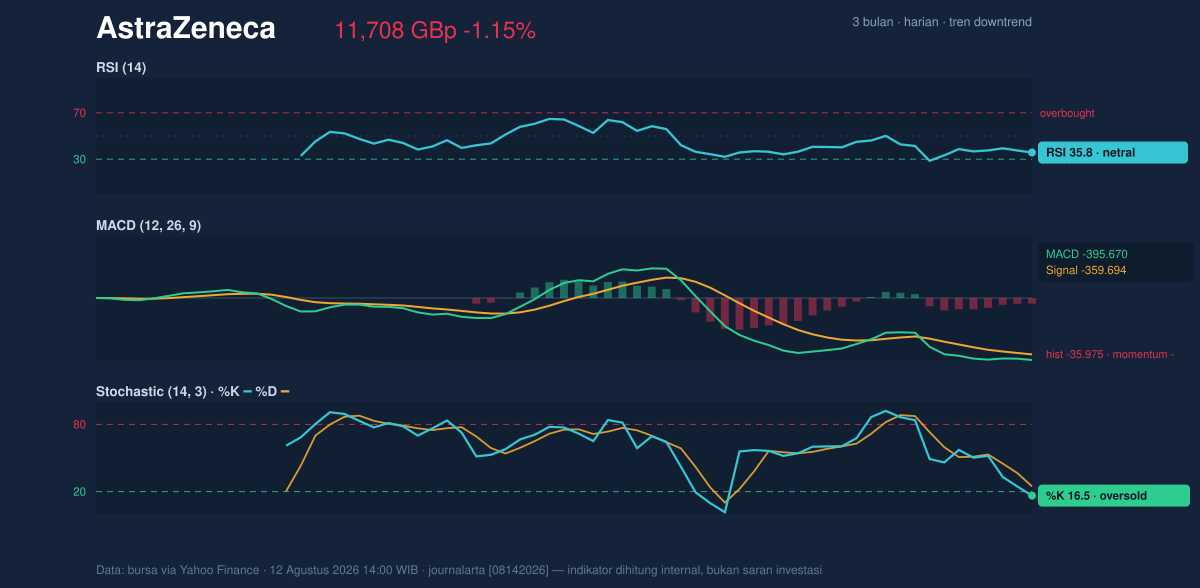
The momentum picture is more nuanced than the trend. The RSI(14) at 35.8 is technically still neutral, but it is leaning toward the weaker side of the scale. That means the stock is not yet in a classic oversold extreme, though it is close enough to imply that downside pressure has already done a fair amount of work. The Stochastic %K at 16.5 and %D at 24.6 is the more emphatic signal, because stochastic readings this low usually indicate the share price is near the bottom of its recent trading envelope. For general readers, that does not guarantee a rebound; it simply means the stock is stretched on the downside relative to recent history.
The MACD at -395.670, with the signal line at -359.694 and a histogram of -35.975, still points to negative momentum. In practical terms, MACD is saying the downtrend has not yet fully exhausted itself. The histogram being below zero shows the gap between trend and signal remains bearish, even if the short-term oscillator is moving toward oversold territory. As shown in the momentum chart, this is a market where weakness is still in control, but where the pace of deterioration may be slowing.
Volatility & Volume
Volatility is present, but not extreme. The ATR(14) at 403.22, equal to 3.4% of price, suggests the stock can still move a meaningful distance in a day without that move being unusual. That matters because a stock trading below key averages can still produce sharp countertrend rallies, especially when volatility is moderate rather than compressed. At the same time, the Bollinger Bands show price leaning toward the lower edge: the lower band is 11,410.89, the middle band is the SMA20 at 12,351.30, and the %B at 16% indicates the shares are trading close to the bottom of the band structure. In simple terms, price is not just weak; it is weak relative to its recent statistical range.
The band width of 15.2% is described as normal, so there is no strong volatility squeeze signaling an imminent expansion. That reduces the case for a dramatic breakout move based purely on compression. Volume also tempers the message. The latest volume of 1,677,782 is only 0.4× the 20-hour average of 4,187,640, which means the latest decline has not been met with heavy participation. That can be read two ways: sellers are still in charge, but they are not showing panic-level conviction. The OBV is rising, which is important because on-balance volume tracks whether money flow is quietly improving even when price is not. A rising OBV against a falling share price can sometimes hint that larger investors are accumulating gradually, though the price itself has not yet confirmed that story.
Key Levels & Scenarios
The market is now focused on a narrow technical corridor. The first level to watch is the 11,500.00 support. If that floor holds, the stock may continue to stabilize near the lower Bollinger Band at 11,410.89 without breaking the current structure. If it fails, the chart would likely shift into a more fragile setup because there is less nearby support visible in the data provided.
On the upside, the first meaningful barrier is the 13,134.00 resistance, which sits close to the SMA20 at 12,351.30 and below the upper Bollinger Band at 13,291.71. A move back above the 20-day average would be the earliest sign that the recent downtrend is easing. A push through resistance would matter more because it would show price has reclaimed the zone where short-term traders begin to lose control.
Technical Verdict: HOLD (wait & see)
- Reason 1: The stock remains below both the SMA20 and SMA50, and the SMA20 slope is negative, which keeps the trend biased lower.
- Reason 2: The MACD is negative, confirming bearish momentum has not yet fully reversed.
- Reason 3: The Stochastic is oversold and %B is 16%, which argues for caution because the shares are stretched near the lower end of the band.
- Verdict invalidated if price breaks below 11,500.00, because that would remove the nearest support and strengthen the downside structure.
Ideal Entry Range: 11,500.00 to 11,410.89
Exit Target (Target Price): 12,351.30 to 13,134.00
Stop Loss protection: below 11,410.89
For non-traders, this means the share price is weak but not yet broken beyond its nearest support.
11,708.00 GBp
Summary Data AstraZeneca
| Last price | 11,708.00 GBp |
| Change 1 day / 5 days / 1 month | -1.15% / -2.73% / -6.83% |
| Trend / MA-cross | downtrend / none |
| SMA20 / SMA50 | 12,351.30 / 13,111.52 |
| RSI (14) / Stochastic %K | 35.8 / 16.5 |
| Bollinger %B / ATR | 16% / 403.22 |
| Support / Resistance 20 days | 11,500.00 / 13,134.00 |
| Data as of | 12 Agustus 2026 14:00 WIB |

