MSFT Testing Key Resistance: Stock Gains 3.66% (September 28, 2026)
On September 28, 2026: price 516.17 USD, trend uptrend, RSI 63.5, support 490.30, resistance 516.17. technical analysis of msft stock. MSFT Testing Key…

Microsoft’s shares on NASDAQ rose to 516.17 dollars on 25 September 2026, up from 497.93, as the stock pushed back to the top of its recent range and briefly moved above the upper Bollinger band, a sign that buying has been strong enough to stretch the price beyond its usual statistical envelope. It is a powerful move. But the chart also shows why traders are not treating it as a one-way signal.
Trend & Price Action
The broader setup still points upward. Microsoft is trading above the 20-day average at 500.04 and well above the 50-day average at 475.81, which means the medium-term structure remains constructive and the stock is not merely bouncing from weakness. The 20-day average is also rising, with a 0.51% five-day slope, which matters because it shows the trend is not flat; it is being pulled higher by recent prices rather than drifting sideways.
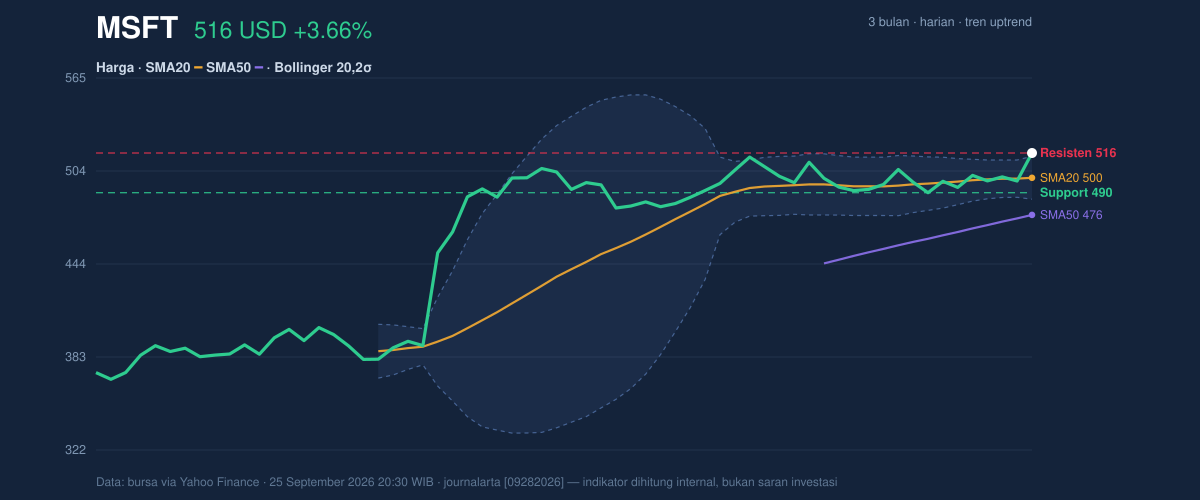
The latest close at 516.17 is especially notable because it sits at the top of the 20-hour range, with support at 490.30 and resistance at 516.17. In practical terms, the stock has already tested the ceiling of its short-term band. The 3-month high at 519.40 now becomes the next visible reference point: a move through that area would suggest the market is trying to extend the trend rather than simply price in a short burst of enthusiasm. The 3-month low at 355.43 remains far below, underscoring how much of the recent action has been an advance from a much lower base.
Oscillators & Momentum
The momentum picture is less clean than the price trend. RSI at 63.5 is still in neutral territory, which means the stock is not yet at a classic overbought extreme. That said, the Stochastic %K at 90.3 versus %D at 62.4 is a different message: short-term momentum is stretched and has moved into overbought territory. In plain English, the stock has been climbing quickly enough that it may need to pause, even if the larger trend remains intact.
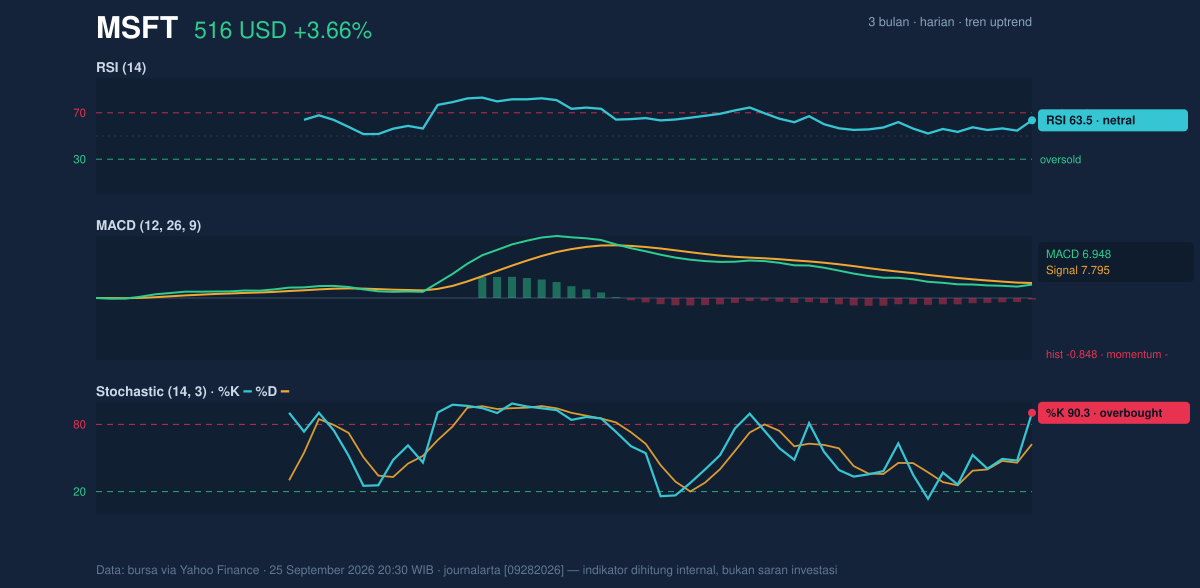
The more cautionary signal comes from MACD. Microsoft’s MACD at 6.948 sits below its signal line at 7.795, leaving a negative histogram of -0.848. That combination means the pace of the advance is no longer accelerating in the same way as before. Price is still elevated, but internal momentum has started to lag. This is often what a late-stage push looks like: the market can still rise, yet each new high requires more effort and the underlying thrust weakens.
Volatility & Volume
The Bollinger structure adds another layer. The band width is just 5.6%, described here as a squeeze, and that usually means volatility has contracted. When price presses against the upper band while the bands are tight, it often signals that the market is coiling for a larger move. The meaning is important: a squeeze does not predict direction by itself, but it does imply that the next expansion could be sharper than recent day-to-day trading.
That is where volume matters. Microsoft traded 38,154,200 shares, about 1.7× the 20-hour average of 21,811,945, and OBV is rising. OBV, or on-balance volume, tracks whether volume is flowing into the stock or away from it; a rising line usually means buyers are still participating rather than fading out. So while MACD is softening, volume is still confirming demand. That mix often produces a market that is strong, but not yet fully settled.
The ATR at 10.95, equal to 2.1% of price, says daily movement is moderate rather than wild. In other words, Microsoft is not in panic-volatility mode. The stock has room to move, but the current structure suggests that moves can still be meaningful even if the day-to-day range looks contained.
Key Levels & Scenarios
The most important short-term line is 516.17, because that is both the latest price and the current resistance marker. If the stock can hold above that area, the chart opens the door toward the 519.40 three-month high. If it fails to hold, the first area to watch is 500.04, the 20-day average and Bollinger middle band, which often acts like a pivot between strength and consolidation. Below that, 490.30 is the next support and the lower edge of the 20-hour range.
The signal from the chart is therefore mixed but constructive: trend and volume remain supportive, yet momentum is stretched and MACD is not confirming the latest push. As shown in the chart, this is the kind of setup where the market can either break higher after a brief pause or cool off toward the moving average before deciding.
Technical Verdict: HOLD (wait & see)
HOLD (wait & see) — the trend is still upward, but momentum is no longer fully aligned.
Why:
- Price is above SMA20 and SMA50, keeping the trend structure positive.
- Stochastic is overbought and MACD is below its signal line, which warns that upside momentum is tiring.
- Volume is 1.7× average and OBV is rising, so buyers have not disappeared.
Verdict invalidated if price breaks below 490.30, because that would weaken the short-term range and raise the odds of a deeper pullback toward the 20-day average zone.
- Ideal Entry Range: 500.04 to 490.30
- Exit Target: 519.40
- Stop Loss protection: below 490.30
In plain English: Microsoft still looks strong, but the chart says the next move is more likely to be a pause-or-breakout decision than a clean, effortless climb.
Summary Data MSFT
| Last price | 516.17 USD |
| Change 1 day / 5 days / 1 month | 3.66% / 4.53% / 2.20% |
| Trend / MA-cross | uptrend / none |
| SMA20 / SMA50 | 500.04 / 475.81 |
| RSI (14) / Stochastic %K | 63.5 / 90.3 |
| Bollinger %B / ATR | 108% / 10.95 |
| Support / Resistance 20 days | 490.30 / 516.17 |
| Data as of | 25 September 2026 20:30 WIB |

