Testing Key Resistance, AMAT Stock Gains 2.27% Today
On September 28, 2026: price 485.00 USD, trend sideways, RSI 55.2, support 415.38, resistance 485.00. technical analysis of amat stock.

Applied Materials is pressing into the top of its recent trading range, but the move still needs confirmation from volume and follow-through. On 25 September 2026, AMAT last traded at 485.00 USD on Nasdaq, up 2.27% on the day and 9.09% over five days, while the broader one-month gain remained modest at 0.55%. That combination matters: the stock is no longer drifting, yet it has not fully escaped the sideways pattern that has defined the chart.
Trend & Price Action
The price sits above the SMA20 at 451.81, which tells traders the short-term trend has improved from its recent base. At the same time, it remains below the SMA50 at 490.25, so the medium-term picture is still capped by a higher moving average that often acts like a ceiling when a stock is trying to regain traction. There is no new MA-cross, which means the chart has not delivered a fresh trend signal; this is more of a recovery inside a range than a confirmed breakout.
The slope of the SMA20 at -0.53% over five days is a subtle warning. It says the short-term average is still easing lower even as price rises, a sign that the rally is running ahead of the trend line rather than being fully supported by it. As shown in the chart, AMAT is trading at 100% of the 20-hour range, with support at 415.38 and resistance at 485.00. That places the stock at the upper edge of its recent band, where momentum often stalls unless buyers keep showing up.
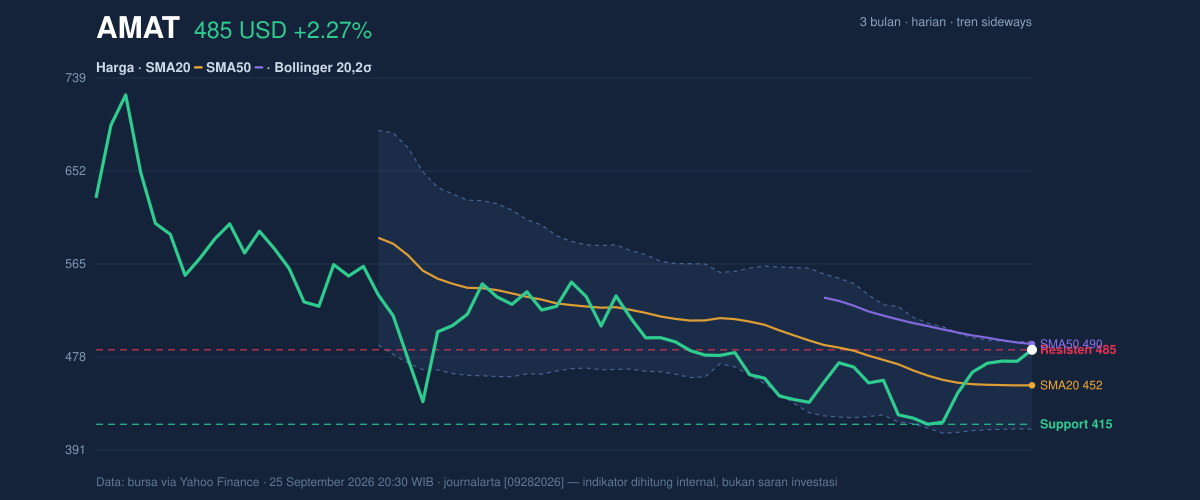
The broader 3-month frame adds context. The stock is still far below its 3-month high of 739.67, but comfortably above the 3-month low of 411.51. In plain terms, AMAT has repaired part of its selloff, yet it has not rebuilt a strong uptrend; it is still working through a long rehabilitation phase.
Oscillators & Momentum
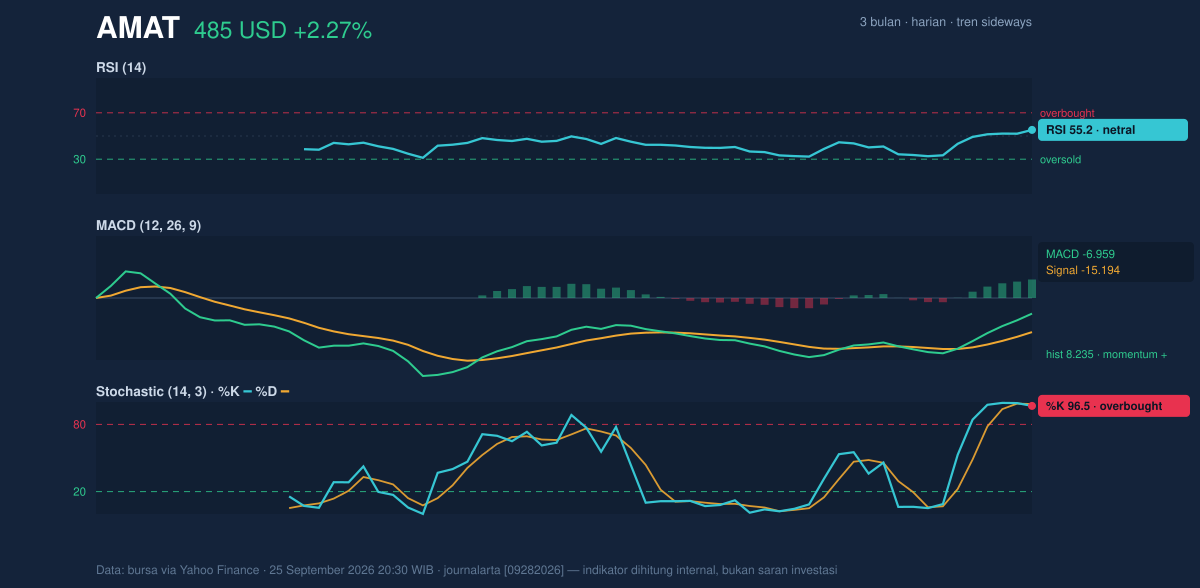
The momentum gauges are mixed, and that mix is the key signal. The RSI at 55.2 is neutral, which means the stock is neither stretched nor washed out on that measure. That is useful because it suggests the recent move is not yet extreme from a broad momentum standpoint.
The more sensitive oscillators are louder. The Stochastic %K at 96.5 and %D at 98.2 are both overbought, which usually means the rally has advanced quickly and may be vulnerable to pause or pullback. This does not automatically mean reversal, but it does mean the stock is trading near the top of its recent momentum envelope. When stochastic readings sit this high while price is already at resistance, the market is often telling you that near-term upside is harder won.
MACD is more constructive. The MACD at -6.959 is still below zero, but the signal line at -15.194 is lower still, leaving a positive histogram of 8.235. That tells readers the downtrend impulse has weakened and momentum is turning upward from a depressed base. In practical terms, MACD is not declaring a clean bull phase, but it is showing that the stock’s internal force is improving faster than the headline level suggests.
Volatility & Volume
The volatility backdrop is important because it explains why the chart can move quickly in either direction. The ATR(14) at 18.23, equal to 3.8% of price, signals elevated daily movement. That means even a normal session can cover a wide distance, which makes nearby support and resistance levels more consequential.
Bollinger Bands reinforce the same message. Price is trading close to the upper band, with the upper Bollinger Band at 492.79 and %B at 90%. A %B reading near 90% means the stock is living near the top of its recent volatility envelope. The band width at 18.1% is normal rather than compressed, so this is not a classic volatility squeeze waiting to erupt. Instead, the chart suggests a stock already in motion, with room to extend if buyers can keep pressure on the upper band.
Volume, however, is not fully confirming the move. Last volume was 5,201,600, below the 20-day average of 6,371,815, or about 0.8x normal. That matters because a push into resistance on lighter participation can fade more easily than one backed by broad turnover. The OBV is rising, though, which is a constructive sign: on-balance volume tracks whether money is generally flowing into or out of a stock, and a rising line suggests accumulation is still present even if the latest session was not especially heavy.
Key Levels & Scenarios
The immediate battle is straightforward. 485.00 is both the last price and the current resistance marker, so the stock is testing the exact level where sellers have been visible. Above that, the next reference comes from the Bollinger upper band at 492.79, which acts like a short-term pressure point.
On the downside, 451.81 is the first important support because it is the SMA20 and the middle Bollinger band. If price slips back below that area, the recent advance starts to look more like a bounce inside a sideways pattern than the beginning of a durable move. The deeper support at 415.38 is the line that would matter if the chart loses its recent repair work.
Technical Verdict: HOLD (wait & see)
HOLD (wait & see) is the clearest reading from this setup. The stock has positive short-term momentum, but it is also pressing into resistance with overbought stochastic readings and only average volume support.
- Reason 1: Price is above SMA20 and the MACD histogram is positive, which shows improving trend pressure.
- Reason 2: Stochastic is overbought and price is near the upper Bollinger Band at 492.79, so upside is already stretched in the short run.
- Reason 3: Volume is only 0.8x normal, so the move has not yet earned strong participation.
- Verdict invalidated if price breaks below 451.81, because that would put AMAT back under the short-term trend line and the Bollinger middle band.
- Ideal entry range: 451.81 to 485.00, where price would be testing support or holding above the recent base.
- Exit target: 492.79, aligned with the upper Bollinger Band.
- Stop loss protection: 415.38, the 20-hour support level.
For non-traders, this means AMAT is improving, but it has not yet proved that the latest rise can turn into a cleaner trend. “The stock is leaning upward, but it is still standing at the door rather than inside the room.”
Summary Data AMAT
| Last price | 485.00 USD |
| Change 1 day / 5 days / 1 month | 2.27% / 9.09% / 0.55% |
| Trend / MA-cross | sideways / none |
| SMA20 / SMA50 | 451.81 / 490.25 |
| RSI (14) / Stochastic %K | 55.2 / 96.5 |
| Bollinger %B / ATR | 90% / 18.23 |
| Support / Resistance 20 days | 415.38 / 485.00 |
| Data as of | 25 September 2026 20:30 WIB |

