QCOM Stock Technicals Today: Gains 3.97%, Testing Key Resistance
On September 28, 2026: price 201.97 USD, trend uptrend, RSI 67.9, support 164.19, resistance 201.97. technical analysis of qcom stock. QCOM Stock Technicals —…

Qualcomm Inc. pushed higher on NASDAQ on 25 September 2026, with QCOM last changing hands at 201.97 USD, up from 194.26 the previous close, as the stock extended its short-term rebound into the upper edge of its recent trading band. The move matters because it is not just a one-day pop: the shares are up 3.97% on the day, 13.65% over 5 days and 22.57% over 1 month, a pattern that signals broad buying interest rather than a single headline-driven spike. But the chart also shows the rally is now pressing against technical limits that often decide whether momentum keeps running or pauses.
Trend & Price Action
The trend structure remains constructive. QCOM is in an uptrend, with the SMA20 at 181.15 and the SMA50 at 170.24, while price sits above the SMA20. That positioning tells traders the stock has already recovered above its short- and medium-term average cost bases, which often supports further upside because holders are no longer underwater at those reference points. The SMA20 slope of 5.16% over 5 days also shows the short-term trend is still rising, not flattening.
The absence of a fresh MA-cross is important. A moving-average crossover is a lagging signal, so “no new crossover” means the current strength is being driven more by price acceleration than by a brand-new trend shift. As shown in the chart, the stock is now trading at the top of its 20-hour range, with support at 164.19 and resistance at 201.97. That is a technically crowded zone: price has already reached the ceiling, so the next move depends on whether demand can absorb sellers here.
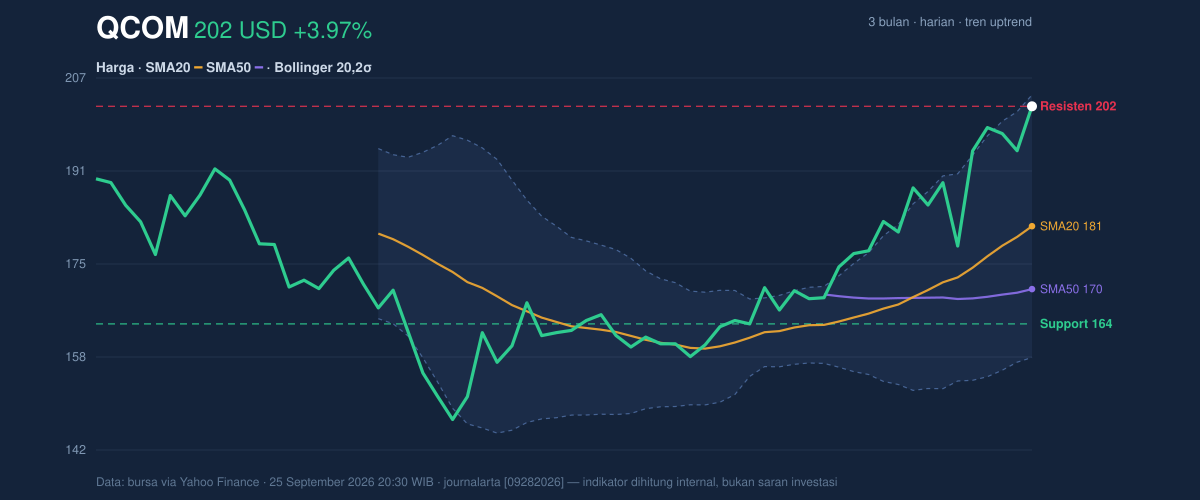
The 3-month range frames the move more clearly. QCOM has climbed from a 3-month low of 142.89 toward a 3-month high of 208.86, meaning the stock is now operating close to the upper end of its recent historical corridor. That usually improves sentiment, but it also leaves less room for easy continuation unless momentum stays strong.
Oscillators & Momentum
The momentum picture is mixed, and that mix is the key signal. The RSI at 67.9 is still described as neutral in the data, but it is close to the threshold where momentum starts to look stretched. In plain language, RSI measures whether gains have become too one-sided; here, it says the stock is strong, but not yet in a full-blown overheating zone.
The Stochastic %K at 89.0 and %D at 88.6 are more aggressive. Stochastic is a faster oscillator, and readings near 90 usually mean price is closing near the top of its recent range. That is classic overbought behavior, which does not automatically mean reversal, but it does mean buyers are chasing strength rather than entering from a discount.
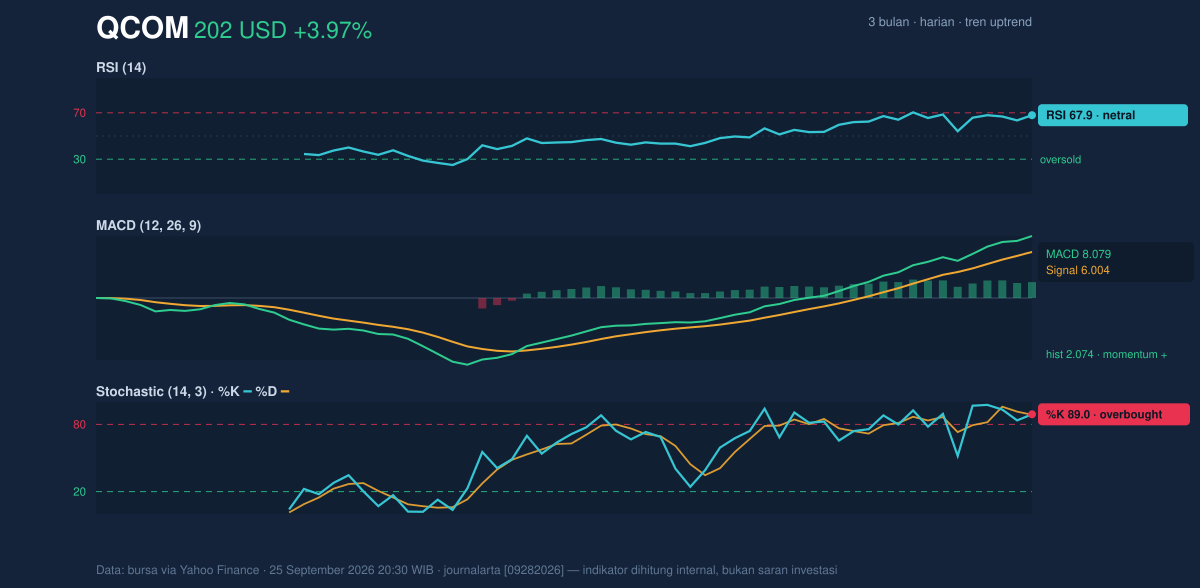
MACD is still supportive. The MACD at 8.079 is above the signal line at 6.004, with a histogram of 2.074, which indicates positive momentum remains in place. In practical terms, MACD is telling us trend-following buyers still have the upper hand, even if shorter-term oscillators are warning that the move is getting extended. That combination often produces either a brief consolidation or a continuation burst; the difference usually depends on volume and whether price can hold above nearby support.
Volatility & Volume
Volatility is elevated, and that matters because strong trends can become unstable when the market starts moving this fast. The Bollinger Bands show the upper band at 203.95, the middle band at 181.15, and the lower band at 158.36. With %B at 96%, price is sitting very close to the top band, a sign that QCOM is trading near the upper boundary of its recent statistical range. The 25.2% band width and ATR(14) of 10.32 — equal to 5.1% of price — confirm that the stock is moving with high volatility. For readers, ATR is a measure of typical daily movement; a higher reading means larger swings are more likely.
Volume adds some confirmation, but not full conviction. The latest volume of 17,805,500 is about 1.2× the 20-hour average of 14,563,915, which suggests participation is above normal. That is supportive. However, the OBV is down, and that is a caution flag: on-balance volume tracks whether volume is broadly backing price advances. A falling OBV while price rises can mean the rally is not being confirmed by the broader accumulation pattern, so the move may be more fragile than the headline price suggests.
The message is simple: momentum is real, but it is not yet cleanly synchronized.
Key Levels & Scenarios
The immediate technical map is tight. Resistance is 201.97, which is also the latest price, so the stock is testing the market’s willingness to pay above the current level. Above that, the next visible reference is the Bollinger upper band at 203.95, followed by the 3-month high at 208.86. On the downside, the first meaningful cushion is the SMA20 at 181.15, then the 20-hour support at 164.19, with the Bollinger lower band at 158.36 providing a deeper volatility floor.
If QCOM can hold above the 181.15 area after any pullback, the chart would still look like a healthy trend pause rather than a failed breakout. If it loses that zone, the market would be saying the recent surge was too extended to sustain. The fact that the stock is already at 100% of its 20-hour range underlines how much of the near-term move has been used up.
Technical Verdict: HOLD (wait & see)
HOLD (wait & see) is the cleanest reading from the technicals.
- Reason 1: Trend is positive, with price above the SMA20 at 181.15 and SMA50 at 170.24, and MACD remains above signal.
- Reason 2: Momentum is stretched, with Stochastic at 89.0 / 88.6 and %B at 96%, suggesting price is pressing the upper boundary of its range.
- Reason 3: Volume is above average, but OBV is down, so the rally lacks full confirmation from broader accumulation.
- Verdict invalidated if price breaks below 181.15, because that would mean QCOM has lost its short-term trend anchor.
- Ideal Entry Range: 181.15 to 181.15, with the stronger technical context coming on weakness toward the SMA20.
- Exit Target: 203.95 to 208.86, using the Bollinger upper band and the 3-month high as reference resistance.
- Stop Loss protection: 164.19, aligned with the 20-hour support.
For non-traders: the stock is strong, but it is also close to a technical ceiling, so the chart is asking for confirmation rather than enthusiasm.
The latest volume was 17,805,500.
Summary Data QCOM
| Last price | 201.97 USD |
| Change 1 day / 5 days / 1 month | 3.97% / 13.65% / 22.57% |
| Trend / MA-cross | uptrend / none |
| SMA20 / SMA50 | 181.15 / 170.24 |
| RSI (14) / Stochastic %K | 67.9 / 89.0 |
| Bollinger %B / ATR | 96% / 10.32 |
| Support / Resistance 20 days | 164.19 / 201.97 |
| Data as of | 25 September 2026 20:30 WIB |

