QCOM Stock Gains 1.39%, Testing Support Level In Focus
On October 13, 2026: price 176.86 USD, trend sideways, RSI 46.3, support 174.43, resistance 201.97. technical analysis of qcom stock. QCOM Stock Gains — full…
By Elena Vance
October 14, 20264 min read
QCOM Stock Gains 1.39%, Testing Support Level In Focus
Qualcomm rose 1.39% on Nasdaq to $176.86, a one-day rebound that leaves the chipmaker’s shares down 2.30% over five trading days and 5.83% over a month. The stock is drawing attention because JournalArta has not covered it in the past 14 days; technically, the latest gain has yet to reverse a weaker short-term pattern.
Trend & Price Action
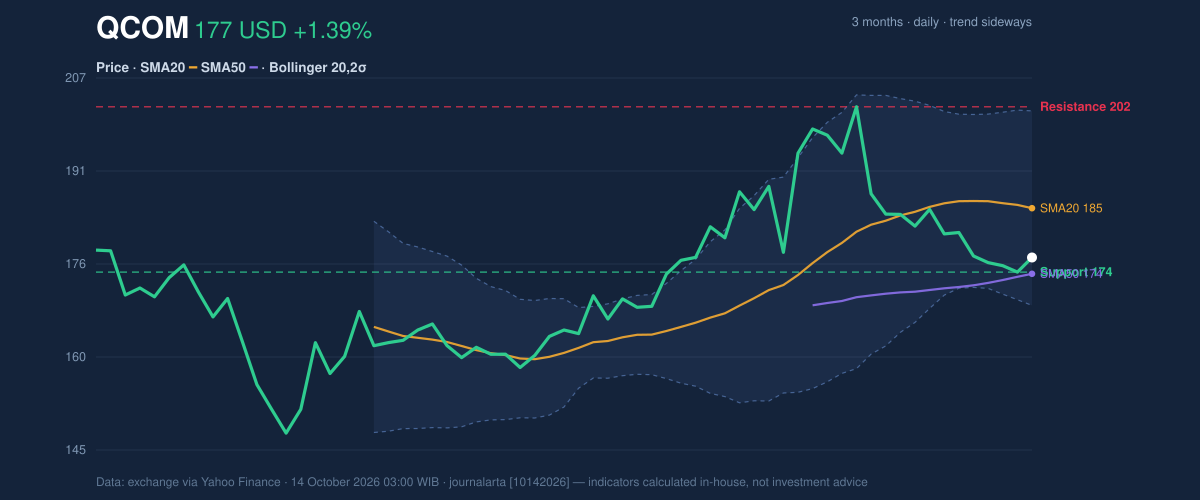
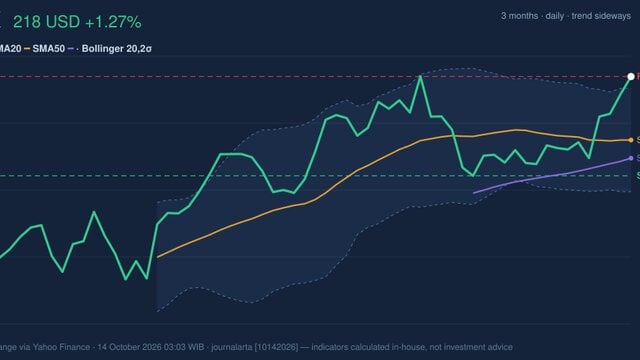
3-month price action chart of QCOM: price, SMA20/50, Bollinger, support & resistance. Data: exchange via Yahoo Finance.
The price remains below its 20-day simple moving average (SMA) of $185.08, while sitting just above its 50-day average of $174.15. A simple moving average tracks the mean closing price over a set period. The gap suggests recent trading has been soft, even as the longer average offers a nearby reference point. The 20-day average is also declining, down 0.62% over five trading days. There has been no fresh crossover between the averages to signal a clear change in trend.
The broader picture is mixed rather than uniformly bearish: QCOM is within its three-month range of $142.89 to $205.85, but the current price sits near the lower end of the 20-trading-day range, whose stated support is $174.43 and resistance is $201.97. The 20-day support is close to the 50-day average, making this area an important test. A sustained move back above the 20-day average would improve the short-term structure; a failure to hold the nearby support would weaken it.
[ GRAFIK-HARGA ]
Oscillators & Momentum
Momentum indicators are not yet confirming the daily rebound. The RSI is neutral at 46.3; the Relative Strength Index gauges the pace of recent gains and losses, with readings near the midpoint generally indicating neither strong buying nor selling pressure. Stochastic readings are oversold, with %K at 16.8 and %D at 13.1. Oversold means the measure has fallen to a level often associated with heavy recent selling, but it does not by itself establish that a recovery has begun.
The MACD remains negative: MACD is -0.225, below its 1.930 signal line, with a -2.155 histogram. MACD compares shorter- and longer-term price averages to assess momentum; its negative readings indicate that downward pressure still outweighs the one-day advance. Taken together, the Stochastic readings leave room for a bounce, while the MACD cautions that momentum has not turned.
[ GRAFIK-MOMENTUM ]
Volatility & Volume
QCOM’s Bollinger Bands place the price closer to the lower band than the middle: the lower band is $168.88, the middle is $185.08 and the upper band is $201.28. The %B reading of 25% means the price is in the lower quarter of the band range. Band width is 17.5%, described as normal, so the data do not point to an unusually compressed trading range that might precede a sharp expansion.
Volatility remains material. Average True Range (ATR), a measure of typical daily price movement, is $6.71, or 3.8% of the share price. That makes short-term moves potentially sizeable relative to the current price. Participation offers little confirmation of the rebound: volume was 12,298,800 shares, about 0.9 times the 20-day average of 13,154,140, while On-Balance Volume (OBV)—a running measure that combines price direction with trading volume—was falling. The advance therefore came on lighter-than-average turnover as cumulative volume pressure weakened.
Key Levels & Scenarios
[ GRAFIK-HARGA ]
The immediate reference is $174.43 support, close to the 50-day average. Holding that zone would preserve the possibility that the latest gain is a pause in the decline; a break below it would invalidate that case and put the lower Bollinger band at $168.88 in focus. On the upside, $185.08 is the first significant hurdle, where the 20-day average sits. A move through it would improve the short-term picture, but the stated 20-day resistance remains $201.97, close to the $201.28 upper band.
Technical Verdict: HOLD (wait & see)
The indicators support a cautious, conditional stance:
- Ideal Entry Range: $174.43–$185.08, bounded by the stated 20-day support and the 20-day average.
- Exit Target (Target Price): $201.28–$201.97, using the upper Bollinger band and stated resistance.
- Stop Loss protection: Below $168.88, the lower Bollinger band.
- Invalidation: The HOLD view is invalidated if price falls below $174.43 support.
The basis is the price holding above the 50-day average, oversold Stochastic readings and a still-negative MACD, with declining OBV and a falling 20-day average tempering the signal. The technical picture is a tentative rebound at support, not a confirmed shift to upward momentum.
For non-traders, the shares have bounced, but the indicators have not yet established that the decline has ended.
| Indicator | Reading |
|---|---:|
| Last price | $176.86 |
| SMA20 / SMA50 | $185.08 / $174.15 |
| RSI / Stochastic | 46.3 / 16.8 and 13.1 |
| MACD / histogram | -0.225 / -2.155 |
| ATR | $6.71 |
| Volume / 20-day average | 12,298,800 / 13,154,140 |
| Support / resistance | $174.43 / $201.97 |
Summary Data QCOM
Last price
176.86 USD
Change 1 day / 5 days / 1 month
1.39% / -2.30% / -5.83%
Trend / MA-cross
sideways / none
SMA20 / SMA50
185.08 / 174.15
RSI (14) / Stochastic %K
46.3 / 16.8
Bollinger %B / ATR
25% / 6.71
Support / Resistance 20 days
174.43 / 201.97
Data as of
14 October 2026 03:00 WIB
Disclaimer: This technical analysis is generated automatically from exchange data (via Yahoo Finance) and indicators calculated by JournalArta, for information and education only. The verdict and the entry, target and stop-loss levels are not investment advice or a solicitation to buy or sell any security. Investment decisions and their risks rest solely with the reader.