ORCL Stock Analysis: Gains 4.23%, Momentum Gains
On October 13, 2026: price 143.20 USD, trend sideways, RSI 50.7, support 132.60, resistance 150.59. technical analysis of orcl stock. ORCL Stock Analysis —…
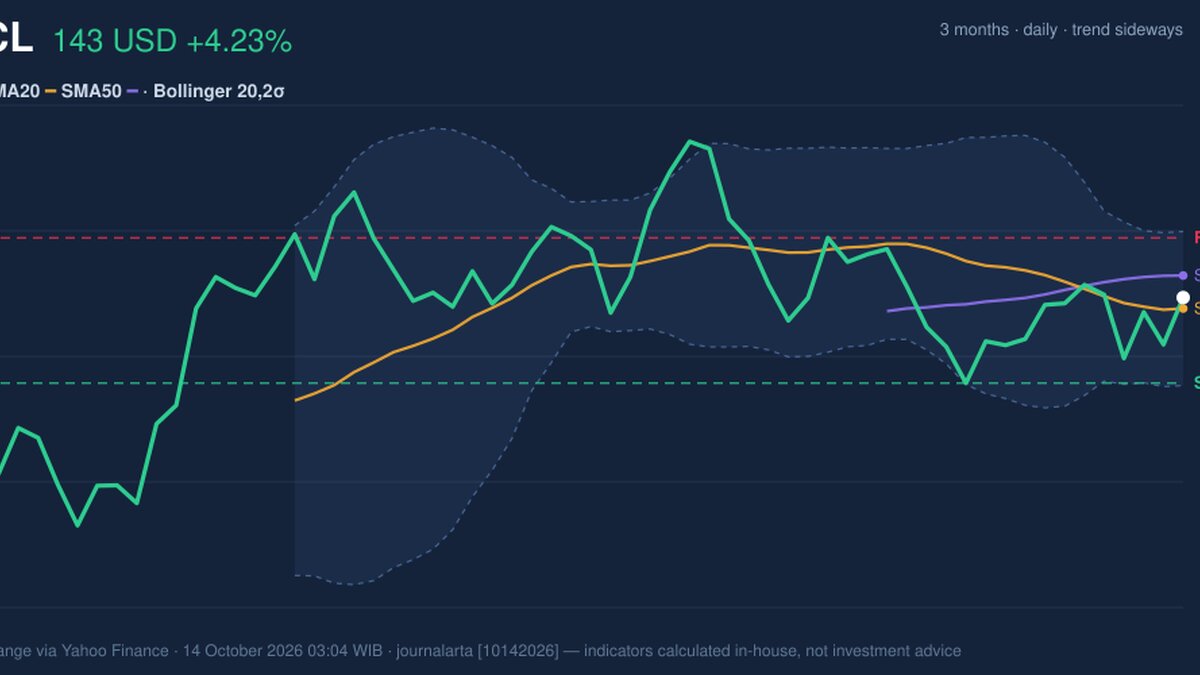
Why ORCL is in focus today
- MACD histogram has just turned positive
Selected automatically from 30 NYSE (US) stocks by a technical-signal score with daily weighted randomisation — not a recommendation.
Trend & Price Action
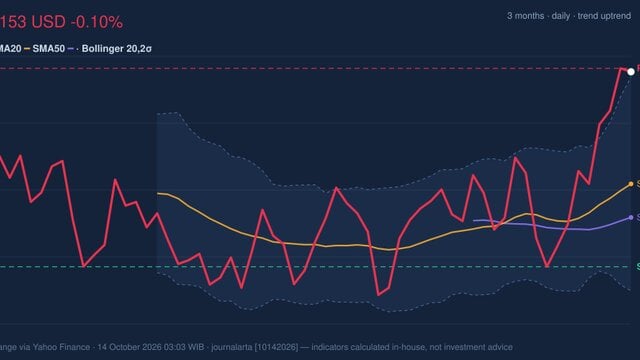
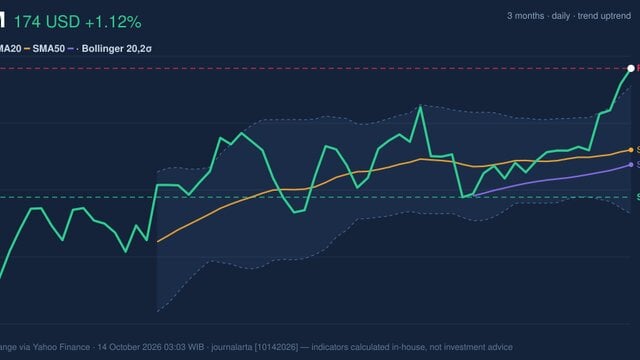
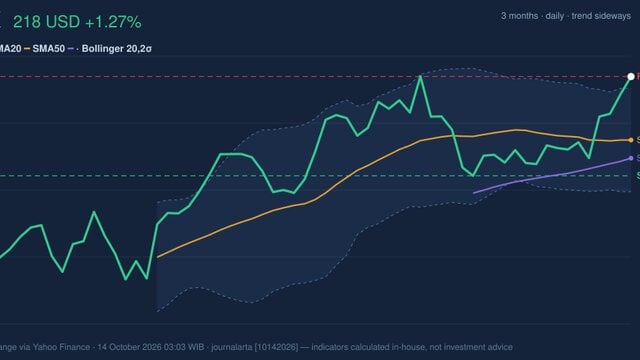
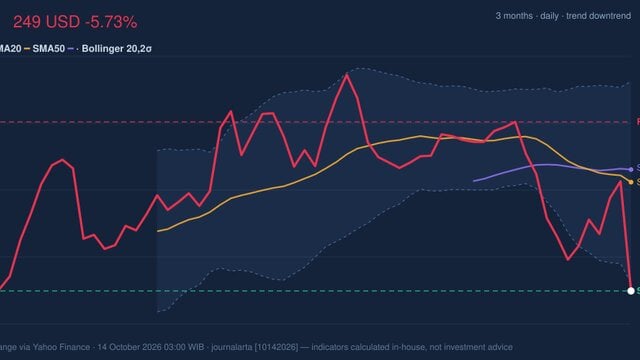
The daily jump lifted Oracle above its 20-day simple moving average, or SMA20—a measure of the average closing price over the past 20 trading days. But at $141.84, that average has been sloping down, falling 1.69% over five days. The share price also remains below the SMA50 at $145.92. Together, those readings suggest a short-term bounce inside a broader sideways structure, not yet a confirmed change in trend. There has been no recent crossover between the two averages. The rebound is meaningful, but it needs follow-through. Oracle is 59% of the way through its 20-day range, between support at $132.60 and resistance at $150.59. Over the past three months, the broader range has been much wider, from $114.50 to $170.70, a reminder that a sideways near-term pattern can still sit within substantial longer-term swings. The price is above the short-term average but has not reclaimed the longer-term one. As shown in the chart, the Bollinger Bands—the range around a moving average that helps show how far prices have moved from their recent norm—run from $132.31 to $151.38, with a midpoint of $141.84. Oracle’s position at 57% of the band places it just above the middle, rather than near an extreme. The 13.4% band width is described as normal, so the data does not point to an unusually compressed setup or a sudden volatility expansion.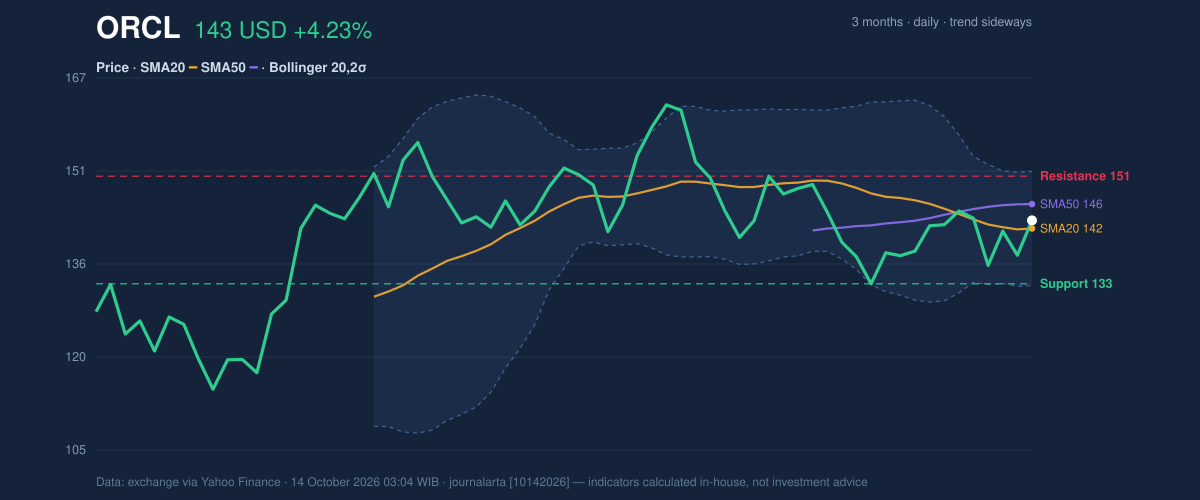
Oscillators & Momentum
The newly positive MACD histogram is the selection signal for the day. MACD compares shorter- and longer-term price averages to gauge momentum; its histogram turning positive means the MACD line has moved slightly above its signal line. Here, MACD stands at -1.373 against a signal of -1.414, with a histogram of 0.040. That is an early improvement, but both lines remain below zero, so momentum has not yet established a strong positive position. The other indicators counsel patience. The 14-day RSI, a gauge of the speed and scale of recent price moves, is neutral at 50.7. Stochastic readings are also classified as neutral, with %K at 75.7 and %D at 51.4. The higher %K shows stronger recent positioning within the indicator’s range, but the supplied reading does not confirm an overbought signal. In combination, the indicators show a tentative momentum turn without broad confirmation.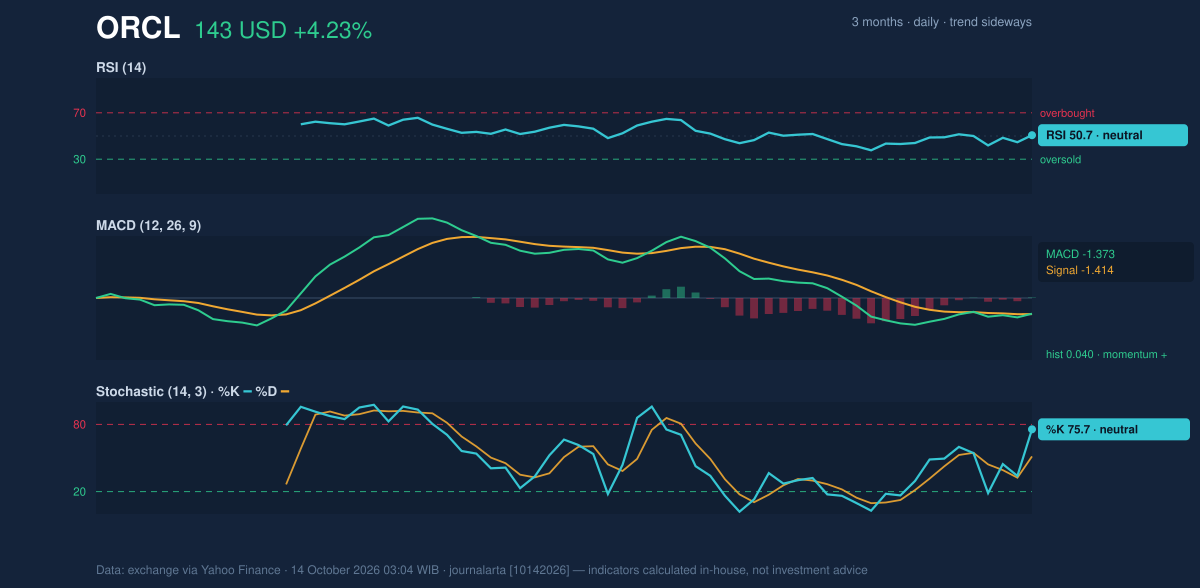
Volatility, Volume & Levels
Oracle’s average true range, a measure of typical price movement, is $6.37, or 4.4% of the share price. That qualifies as high volatility in the supplied data: even when the broader trend is sideways, daily moves can be large. The latest volume of 26,280,500 shares was about 0.9 times the 20-day average of 29,633,060, so the sharp gain came on lighter-than-normal participation. Rising on-balance volume, which tracks whether trading volume is flowing more often on up days or down days, is a constructive counterpoint—but the volume figure tempers the force of the rally. Resistance at $150.59 is the near-term test; support at $132.60 is the key downside level. A sustained move above resistance would strengthen the case that the rebound is broadening. Failure to hold support would weaken it. Those are conditional scenarios, not predictions.Technical Verdict: HOLD
HOLD (wait & see) fits the mixed technical picture. The MACD histogram’s turn positive and the share price’s position above SMA20 point to improving short-term momentum; the neutral RSI and rising OBV add limited support. Against that, the price remains below SMA50, the 20-day average is sloping downward, and the latest gain arrived on below-average volume. The verdict is invalidated if the price falls below $132.60 support. - Reference entry range: $141.84 (SMA20) to $145.92 (SMA50), the area where the short- and longer-term trend measures meet. - Reference exit target: $150.59 resistance; the upper Bollinger Band at $151.38 is a nearby technical reference, not a forecast. - Reference stop-loss protection: $132.31, the lower Bollinger Band, just below the $132.60 support level. These levels describe the technical setup, not an investment recommendation. For non-traders, the signal is that Oracle’s rebound is encouraging but has not yet overcome enough resistance to confirm a sustained uptrend.Summary Data ORCL
| Last price | 143.20 USD |
| Change 1 day / 5 days / 1 month | 4.23% / -1.08% / 2.03% |
| Trend / MA-cross | sideways / none |
| SMA20 / SMA50 | 141.84 / 145.92 |
| RSI (14) / Stochastic %K | 50.7 / 75.7 |
| Bollinger %B / ATR | 57% / 6.37 |
| Support / Resistance 20 days | 132.60 / 150.59 |
| Data as of | 14 October 2026 03:04 WIB |
Disclaimer: This technical analysis is generated automatically from exchange data (via Yahoo Finance) and indicators calculated by JournalArta, for information and education only. The verdict and the entry, target and stop-loss levels are not investment advice or a solicitation to buy or sell any security. Investment decisions and their risks rest solely with the reader.
Track ORCL stock price daily: live levels, support/resistance and our full ORCL analysis history.