CVX Stock Technicals: Gains 1.27% on Tuesday, Testing Key Resistance
On October 13, 2026: price 217.73 USD, trend sideways, RSI 67.1, support 202.41, resistance 217.73. technical analysis of cvx stock. CVX Stock Technicals —…
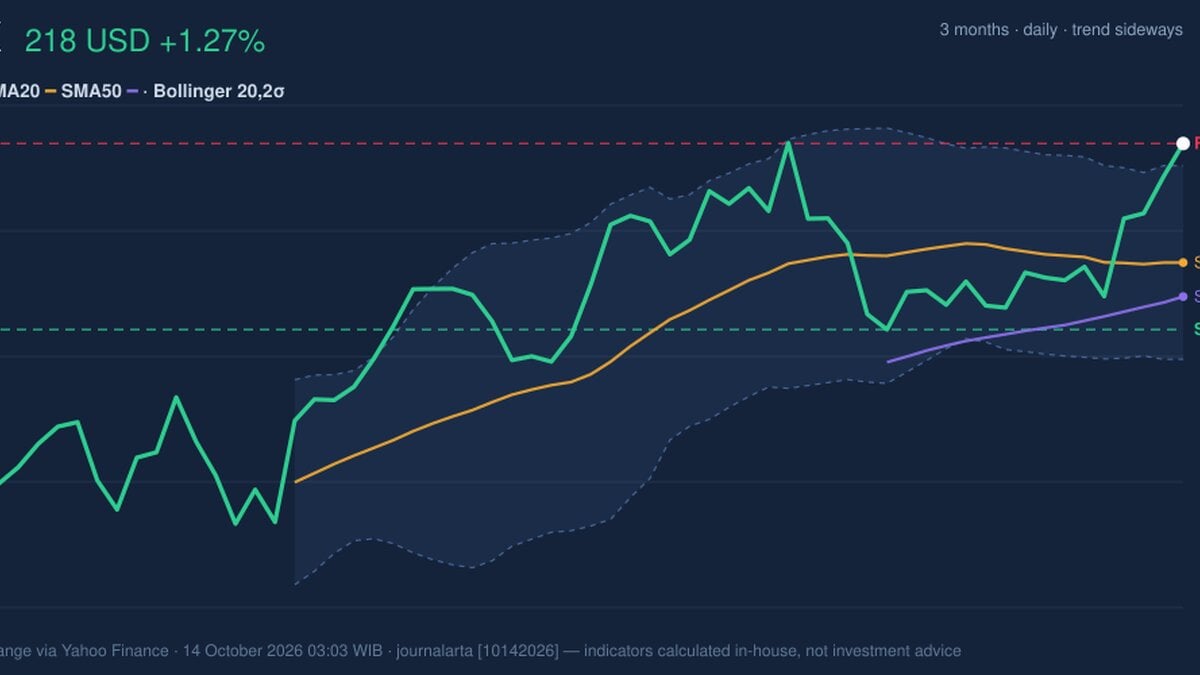
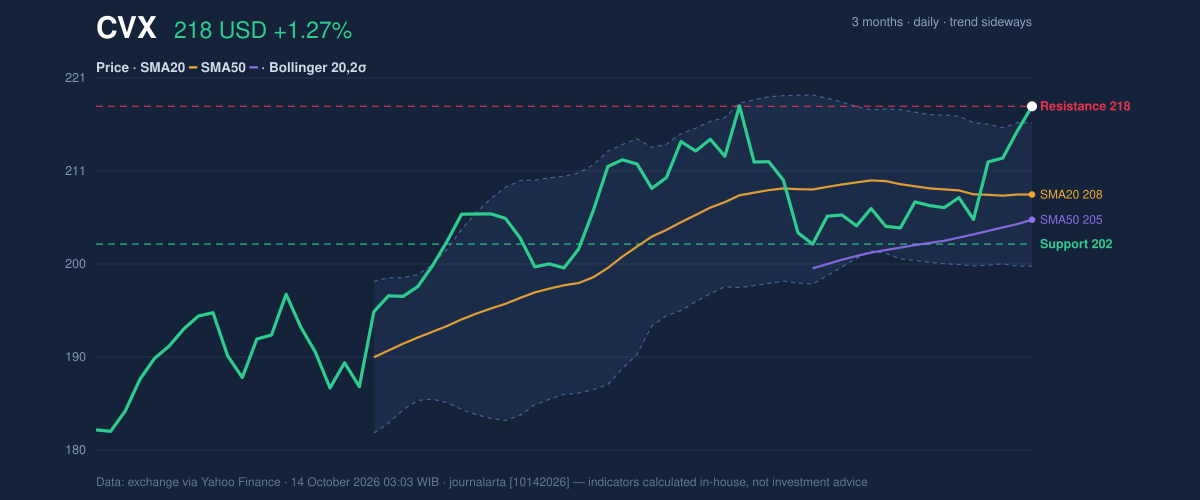
Chevron closed at $217.73, up 1.27%, reaching its highest level in 20 trading days and moving close to its three-month peak of $218.79, according to exchange data via Yahoo Finance as of October 14. The advance comes as the stock emerges from narrowing Bollinger bands, a setup that can precede a larger move but does not, by itself, indicate its direction. Shares are now above the upper band, while trading volume remained below its 20-day average.
Why CVX is in focus today
- Closed at a 20-day high (217.73)
- Trading near its 3-month high (218.79)
- Breaking out of a Bollinger squeeze (band width 7.7%)
- Not covered by JournalArta in the last 14 days
Selected automatically from 30 NYSE (US) stocks by a technical-signal score with daily weighted randomisation — not a recommendation.
Trend & Price Action
Chevron’s short-term structure has improved: the share price sits above both its 20-day average of $207.93 and 50-day average of $205.13. There has been no new crossover between those averages, however, and the 20-day average is still edging lower. That combination points to a rebound within a broadly sideways pattern, not yet a confirmed longer-term trend change.
The stock has gained 4.89% over five days, but its one-month change is nearly flat at -0.02%. That contrast suggests the latest strength is concentrated in a recent burst rather than reflecting a sustained monthly climb. At $217.73, Chevron is also at the top of its 20-day range and close to the three-month high—an area where further gains would need to be supported by demand.
The breakout is testing a ceiling.
The Bollinger bands, which track price relative to a moving average and recent volatility, had narrowed to a 7.7% width. Chevron’s current position at 112% of the band’s range means it has moved above the upper band at $215.89. A squeeze followed by a move beyond a band can signal that trading is becoming more active, but a price above the band can also reflect a short-term stretch. The upper band is therefore a reference point, not a guaranteed support level.
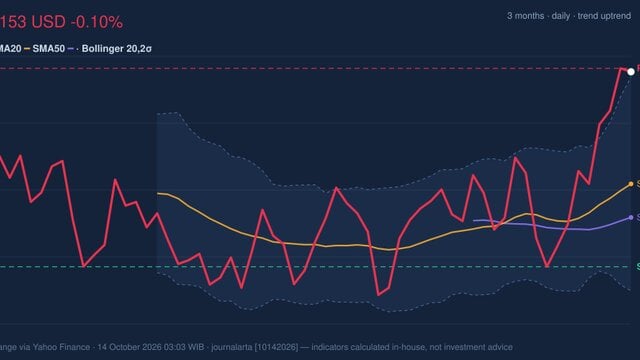
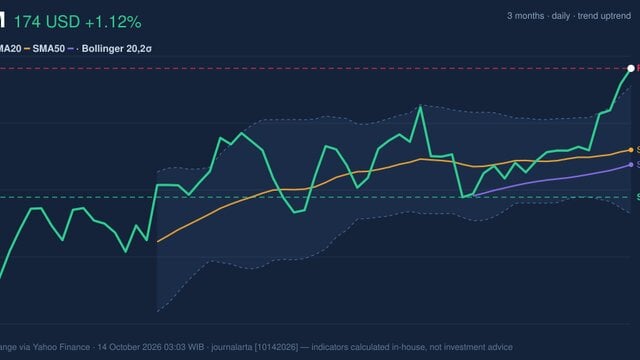
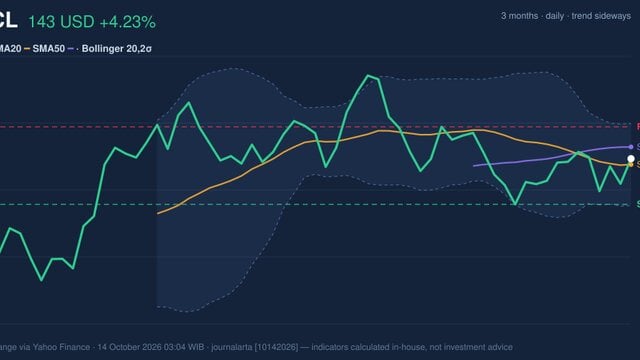
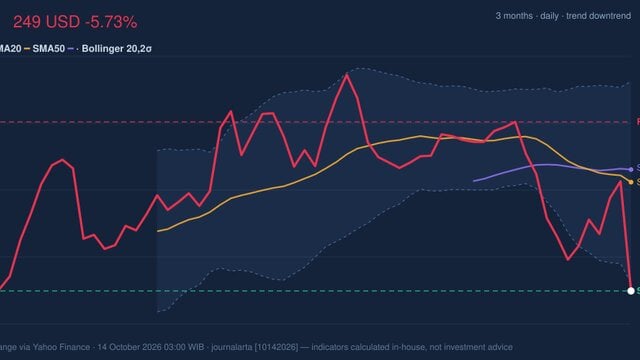
As shown in the chart, price has moved above the moving averages and upper Bollinger band, while the marked resistance coincides with the 20-day high.
Oscillators & Momentum
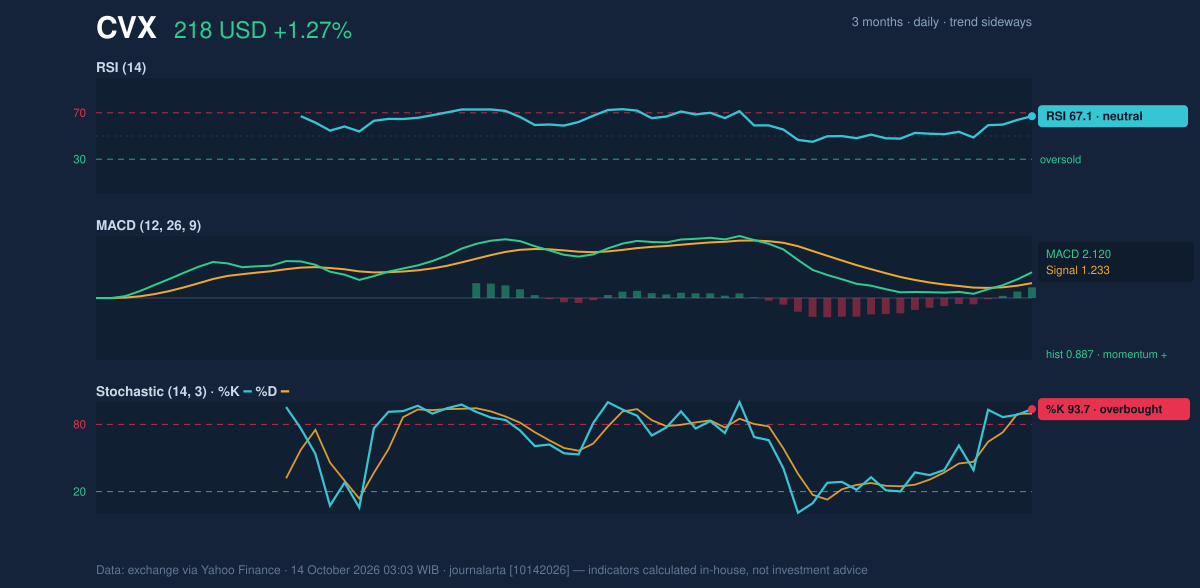
Momentum indicators lean positive, though they do not all tell the same story. The RSI is 67.1, classified as neutral in the supplied data, while the Stochastic is overbought, with %K at 93.7 and %D at 89.6. Stochastic compares a close with the recent trading range; readings this high indicate that price has been closing near the top of that range, which can accompany strong buying but also leave the stock vulnerable to a pause.
The MACD is positive: its reading of 2.120 is above its 1.233 signal line, and its histogram is positive at 0.887. This supports the recent upward push rather than showing a clear loss of momentum. Still, the indicator measures trend momentum, not whether the current price is attractive, and the overbought Stochastic argues for caution about assuming the rise will continue without interruption.
The chart places these readings alongside the price move: MACD confirms positive momentum, while Stochastic warns that the advance is stretched within the recent range.
Volatility, Volume & Key Levels
Average true range, a measure of typical daily price movement, stands at $4.07, or 1.9% of the share price—moderate volatility by the supplied measure. Volume was 7,432,300 shares, about 0.8 times its 20-day average of 9,356,145. The rise therefore came on lighter-than-normal participation, tempering the strength of the breakout signal. On the other hand, rising on-balance volume (OBV), which tracks whether volume is accumulating on up days or down days, suggests buying pressure has been building over the measured period.
The immediate level to watch is $217.73, the 20-day resistance and current price; the three-month high at $218.79 is the next reference in the supplied data. A sustained move beyond that high would strengthen the case that the range is giving way. Failure to hold above the recent breakout area could instead bring the moving averages near $207.93 and $205.13 into focus. The marked 20-day support is $202.41, with the lower Bollinger band at $199.96.
Technical Verdict: HOLD
HOLD (wait & see) is the clearest technical reading of mixed signals. Price above the 20- and 50-day averages, positive MACD, and rising OBV support the advance. But the stock is above its upper Bollinger band, Stochastic is overbought, volume is below average, and resistance at the 20-day high is being tested. The verdict is invalidated if price falls below $202.41, the stated 20-day support.
- Ideal entry range: $207.93–$215.89, bounded by the 20-day average and upper Bollinger band.
- Exit target: $218.79, the three-month high.
- Stop-loss protection: $202.41, the 20-day support.
In plain English, Chevron’s trend has improved, but the stretched momentum and light volume leave confirmation of a durable breakout pending.
Technical analysis is not an investment recommendation.
Summary Data CVX
| Last price | 217.73 USD |
| Change 1 day / 5 days / 1 month | 1.27% / 4.89% / -0.02% |
| Trend / MA-cross | sideways / none |
| SMA20 / SMA50 | 207.93 / 205.13 |
| RSI (14) / Stochastic %K | 67.1 / 93.7 |
| Bollinger %B / ATR | 112% / 4.07 |
| Support / Resistance 20 days | 202.41 / 217.73 |
| Data as of | 14 October 2026 03:03 WIB |
Disclaimer: This technical analysis is generated automatically from exchange data (via Yahoo Finance) and indicators calculated by JournalArta, for information and education only. The verdict and the entry, target and stop-loss levels are not investment advice or a solicitation to buy or sell any security. Investment decisions and their risks rest solely with the reader.
Track CVX stock price daily: live levels, support/resistance and our full CVX analysis history.