JNJ Stock Drops 5.73%, Death Cross Pressure In Focus
On October 13, 2026: price 248.61 USD, trend downtrend, RSI 34.4, support 248.61, resistance 271.95. technical analysis of jnj stock. JNJ Stock Drops — full…
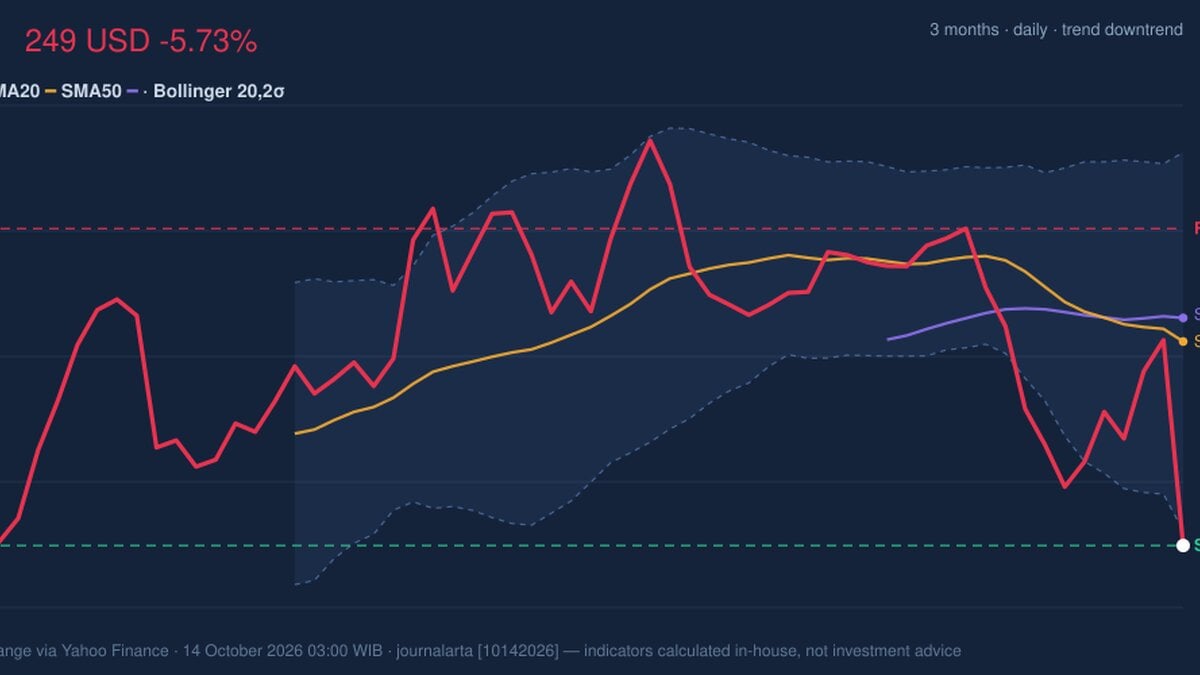
Why JNJ is in focus today
- One-day move of -5.73%, about 2.4× its average daily range (ATR)
- Volume at 2.2× the 20-day average
- Closed at a 20-day low (248.61)
- Trading near its 3-month low (245.17)
- Fresh death cross: SMA20 crossed below SMA50
- Downtrend extending (5-day change -2.42%)
Selected automatically from 30 NYSE (US) stocks by a technical-signal score with daily weighted randomisation — not a recommendation.
Trend & Price Action
JNJ is below both its 20-day simple moving average, or SMA, at $263.63 and its 50-day SMA at $265.37. The 20-day average is also sloping down, and it has crossed below the 50-day average—a technical pattern known as a death cross. It indicates weakening price structure, not a guarantee of further losses. The shares are down 2.42% over five days and 6.96% over one month. They sit at the bottom of the 20-day range, with $248.61 as the near-term support level. The three-month low of $245.17 is close enough to matter: a move below it would put the stock at a new low for that period. As shown in the chart, the price has slipped beneath the lower Bollinger Band, which stands at $249.70. Bollinger Bands plot a moving average with upper and lower boundaries to help show whether price is unusually extended. A close below the lower band can reflect intense selling, but it can also mark a short-term oversold condition. The band width is 10.6%, described as normal, so the data do not show a volatility squeeze that might signal an imminent breakout.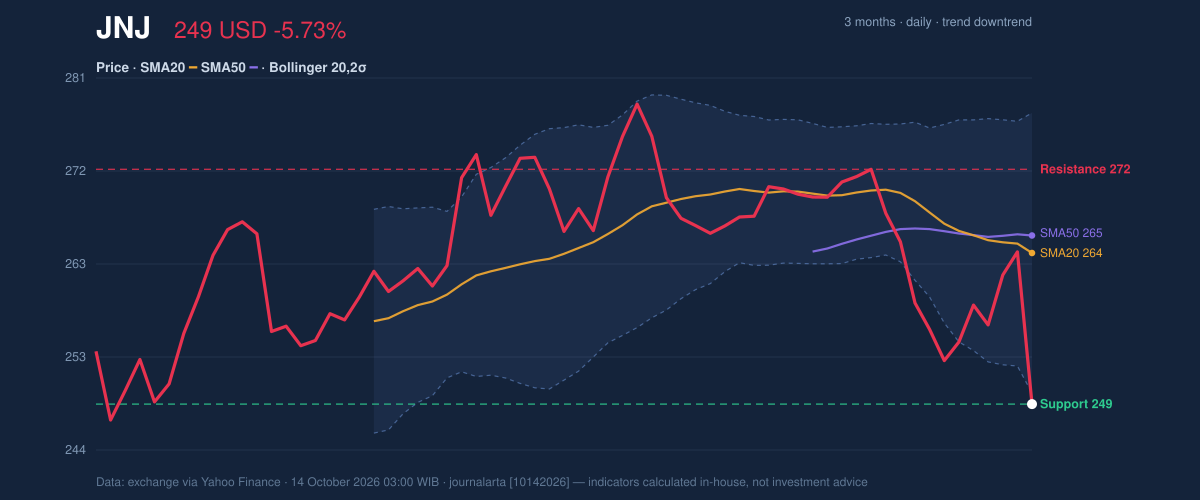
Oscillators & Momentum
Momentum indicators reinforce the weak trend but show different degrees of strain. The RSI, or Relative Strength Index, is 34.4, in neutral territory under the supplied classification. That reading is weak, but it is not itself an oversold signal. The Stochastic oscillator tells a more stretched story: %K is 11.4 and %D is 35.4, an oversold reading. Stochastic compares recent closing prices with their recent trading range; an oversold signal can mean selling has been rapid, but it does not confirm a reversal. MACD, a measure of trend momentum, remains negative: the MACD is -3.099, below its -2.024 signal line, with a negative histogram of -1.075. That alignment says downward momentum is still in control. A turn in the Stochastic alone would be less persuasive without improvement in MACD or a recovery above nearby moving averages.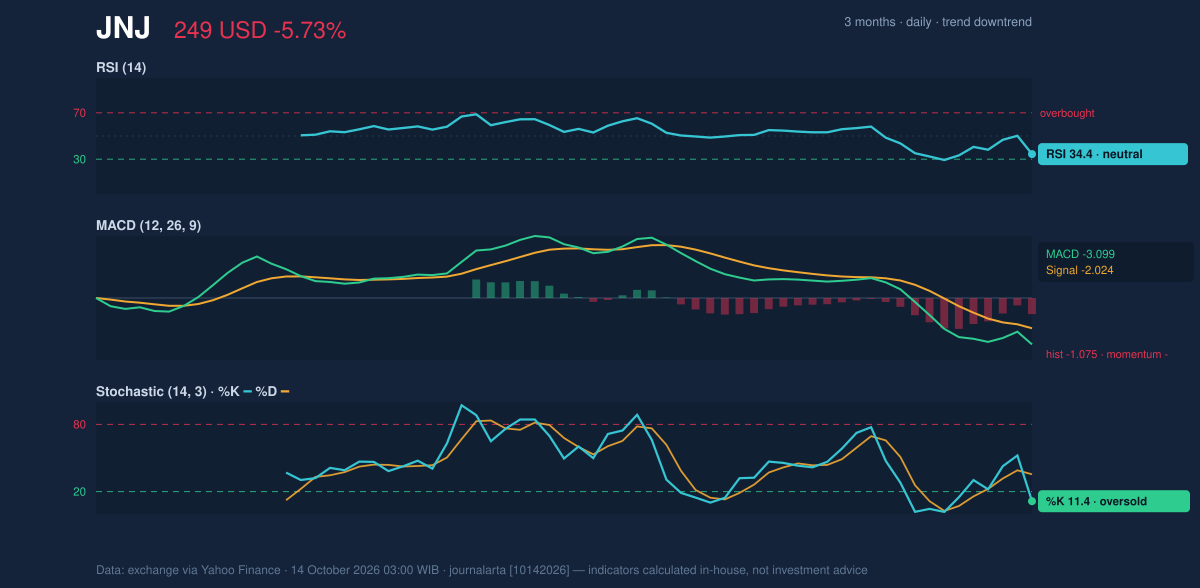
Volatility, Volume & Key Levels
The 14-day ATR, which measures typical price movement, is $6.03, or 2.4% of the share price—moderate volatility by the supplied data. The latest decline was much larger than that typical range, underlining the significance of the session. Volume rose to 16,620,900 shares against a 20-day average of 7,448,910. On-balance volume, which tracks whether volume is associated with rising or falling sessions, also declined. Together, the volume surge and falling OBV support the interpretation that selling pressure was broad rather than a low-volume fluctuation. The first level to watch is $248.61, the 20-day support and latest close. Below it, the three-month low at $245.17 is the next reference point in the supplied data. On a recovery, the lower Bollinger Band at $249.70 is an immediate threshold, followed by the moving averages clustered around $263.63–$265.37. The 20-day resistance is $271.95. Holding support could allow a rebound attempt; a break below the three-month low would instead deepen the weak price structure.Technical Verdict: HOLD (wait & see)
HOLD (wait & see) is the technical reading: the death cross, negative MACD and falling OBV point to continued weakness, while the oversold Stochastic and proximity to the three-month low leave room for a short-term bounce. The verdict is invalidated if the price falls below $245.17, the three-month low.- Ideal Entry Range: $245.17–$249.70, around the three-month low and lower Bollinger Band; this is a technical reference range, not a signal that a reversal is confirmed.
- Exit Target (Target Price): $263.63–$271.95, spanning the 20-day average to 20-day resistance.
- Stop Loss protection: Below $245.17, using the three-month low as the invalidation level.
Summary Data JNJ
| Last price | 248.61 USD |
| Change 1 day / 5 days / 1 month | -5.73% / -2.42% / -6.96% |
| Trend / MA-cross | downtrend / death |
| SMA20 / SMA50 | 263.63 / 265.37 |
| RSI (14) / Stochastic %K | 34.4 / 11.4 |
| Bollinger %B / ATR | -4% / 6.03 |
| Support / Resistance 20 days | 248.61 / 271.95 |
| Data as of | 14 October 2026 03:00 WIB |
Disclaimer: This technical analysis is generated automatically from exchange data (via Yahoo Finance) and indicators calculated by JournalArta, for information and education only. The verdict and the entry, target and stop-loss levels are not investment advice or a solicitation to buy or sell any security. Investment decisions and their risks rest solely with the reader.
Track JNJ stock price daily: live levels, support/resistance and our full JNJ analysis history.