XOM RSI Overbought: Stock Gains 1.12% (October 13, 2026)
On October 13, 2026: price 174.08 USD, trend uptrend, RSI 71.8, support 158.30, resistance 174.08. technical analysis of xom stock. XOM RSI Overbought — full…
Trend & Price Action
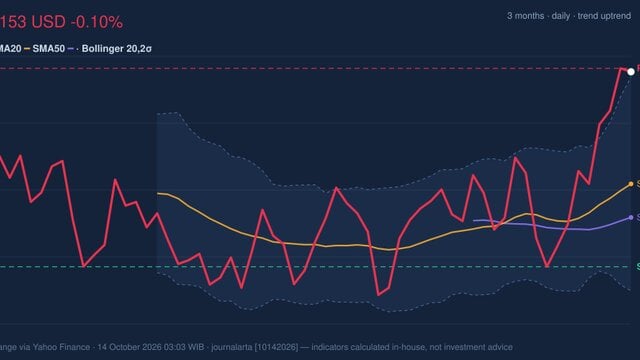
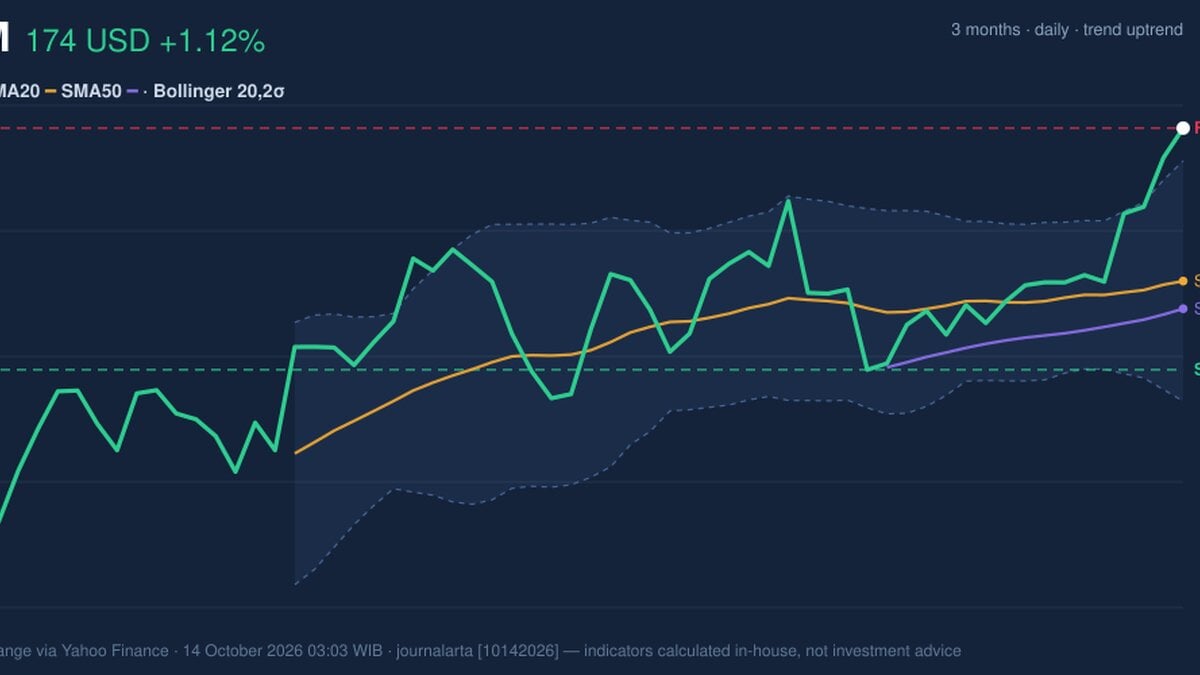
XOM trades above its rising 20-day simple moving average (SMA), at $164.09, and its 50-day SMA, at $162.28. The 20-day average has climbed 0.55% over five days, reinforcing the upward trend; there has been no new crossover between the two averages, so the signal comes from price holding above both rather than a fresh technical turning point. The close matches the stated 20-day resistance of $174.08 and is just below the three-month high of $174.89. That puts the shares at the top of their recorded range, where a break higher would extend the advance, while failure to hold near the peak could leave the stock vulnerable to a pullback toward moving-average support. The chart shows price above both averages and beyond the upper Bollinger Band, a structure consistent with strong but stretched trading.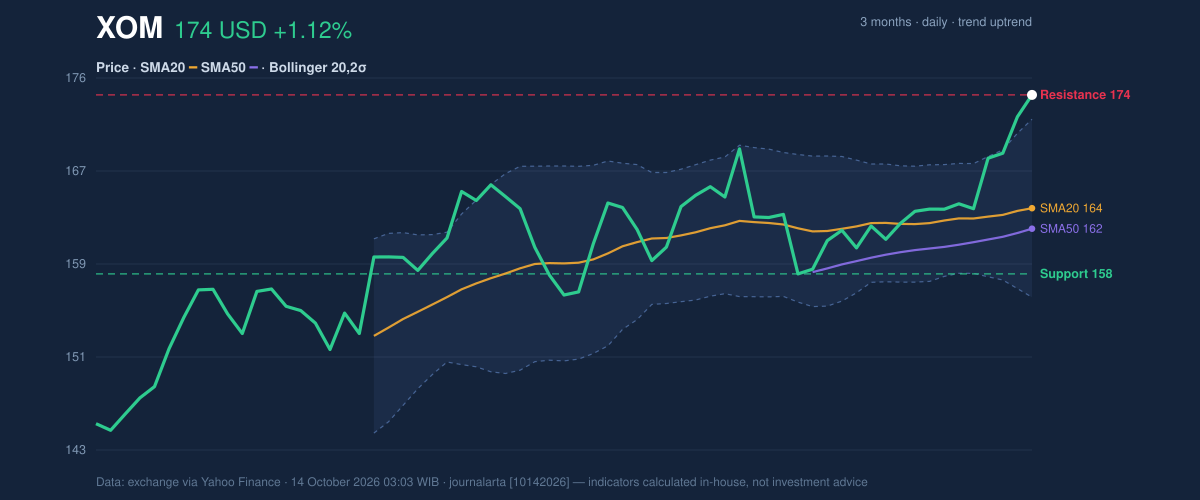
Oscillators & Momentum
The rally has momentum behind it, but the oscillators warn against reading strength as a guarantee of further immediate gains. The RSI is 71.8, in overbought territory, while the Stochastic readings—%K at 94.8 and %D at 94.2—are also overbought. These measures describe recent price speed and position, not a prediction of when the trend will turn; they do suggest the shares may need to pause or consolidate to relieve pressure. The MACD remains positive: its reading of 2.474 is above the 1.434 signal line, and the histogram is positive at 1.040. That alignment supports the broader advance and contrasts with the overbought oscillators. In plain terms, the trend still has positive momentum, even as short-term conditions look crowded.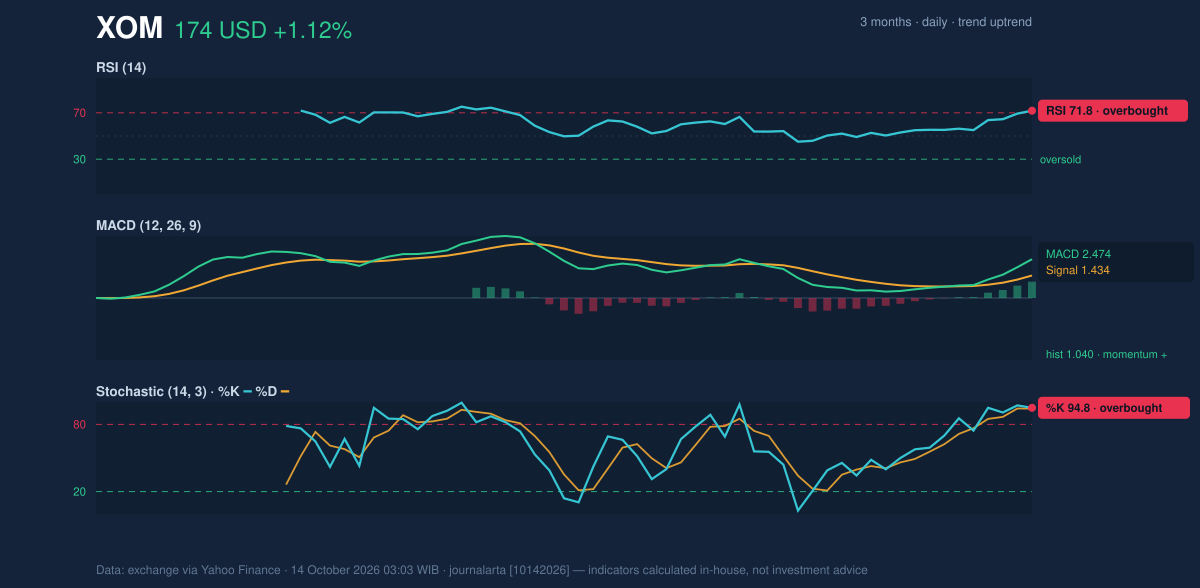
Volatility & Volume
The Bollinger Band reading helps explain the tension. XOM’s price is above the upper band at $171.94, with %B at 114%; %B measures where the price sits relative to the bands, and a reading above 100% means it has moved beyond the upper boundary. The band width is 9.6%, described as normal rather than unusually compressed or expanded, so the move is not accompanied by a squeeze signal. Still, trading above the band reinforces the evidence of an extended short-term rally. Volume was 11.5 million shares, about 0.9 times the 20-day average of 13.0 million. That is not unusually heavy participation for a rising session. On the other hand, OBV—the running measure of volume associated with price direction—is rising, offering some confirmation that buying participation has improved. ATR stands at $3.24, or 1.9% of the share price, indicating moderate day-to-day volatility.Key Levels & Scenarios
The immediate reference is the three-month high at $174.89; a move through it would put the shares beyond the current range, while a failure to hold near that peak would make the rising averages useful support markers. The supplied 20-day support is $158.30, with the lower Bollinger Band at $156.24. These are distinct measures: the support level marks a recent price floor, while the band adjusts with recent volatility.Technical Verdict: HOLD (wait & see)
The trend is positive, but overbought momentum and a close at the range ceiling make the near-term technical picture stretched rather than clearly favorable. The strongest supporting signals are price above the rising SMA20 and SMA50, positive MACD, and rising OBV. The main counterweight is the RSI and Stochastic in overbought territory, alongside price above the upper Bollinger Band. This verdict is invalidated if price falls below $158.30, the stated 20-day support. - Ideal entry range: $164.09–$171.94, between the SMA20 and upper Bollinger Band. - Exit target: $174.89, the three-month high and next stated price reference above the current ceiling. - Stop-loss protection: $158.30, the stated 20-day support. For non-traders, HOLD means the trend remains strong, but the shares are near a high with momentum indicators flashing caution.Market data: exchange data via Yahoo Finance, as of 14 October 2026, 03:03 WIB.
Why XOM is in focus today
- Trading near its 3-month high (174.89)
- RSI(14) at 71.8 — overbought zone
- Uptrend confirmed (5-day change 5.84%)
Selected automatically from 30 NYSE (US) stocks by a technical-signal score with daily weighted randomisation — not a recommendation.
Summary Data XOM
| Last price | 174.08 USD |
| Change 1 day / 5 days / 1 month | 1.12% / 5.84% / 2.81% |
| Trend / MA-cross | uptrend / none |
| SMA20 / SMA50 | 164.09 / 162.28 |
| RSI (14) / Stochastic %K | 71.8 / 94.8 |
| Bollinger %B / ATR | 114% / 3.24 |
| Support / Resistance 20 days | 158.30 / 174.08 |
| Data as of | 14 October 2026 03:03 WIB |
Disclaimer: This technical analysis is generated automatically from exchange data (via Yahoo Finance) and indicators calculated by JournalArta, for information and education only. The verdict and the entry, target and stop-loss levels are not investment advice or a solicitation to buy or sell any security. Investment decisions and their risks rest solely with the reader.
Track XOM stock price daily: live levels, support/resistance and our full XOM analysis history.