QCOM Stock Technicals Today: Gains 9.29%, Golden Cross Formed
On September 22, 2026: price 194.23 USD, trend uptrend, RSI 65.0, support 158.53, resistance 194.23. technical analysis of qcom stock. QCOM Stock Technicals —…

Qualcomm Inc. climbed to 194.23 USD on Nasdaq on 21 September 2026, extending a sharp short-term rally that has pushed the stock 9.29% higher in one day and 20.83% over one month, while trading at the very top of its 20-hour range, according to Yahoo Finance data. The move matters because it is not just a one-day pop: the price is now sitting above both its short- and medium-term trend lines, which suggests buyers have been in control for several sessions. But the speed of the rise also leaves the stock stretched, with some momentum gauges now flashing caution even as trend signals remain constructive.
Trend & Price Action
The chart shows Qualcomm has moved into a clearer uptrend, with price above the SMA20 at 173.95 and above the SMA50 at 168.62, while the golden cross — the shorter average crossing above the longer one — confirms that the recent advance has not been a one-off rebound. In plain language, that crossover often signals that short-term strength has become broad enough to change the trend structure. The SMA20 slope of 3.81% over 5 days reinforces that the trend is still rising rather than flattening out.
What stands out, though, is how extended the move has become. The current price is effectively pressing against the upper edge of the Bollinger Band system, with the upper band at 193.49 and the stock at 194.23. That tells readers the stock is trading beyond its recent statistical range rather than comfortably inside it. When price is this far above the middle band, the market is usually pricing in strong momentum — but also a higher chance of pauses or pullbacks as traders lock in gains.
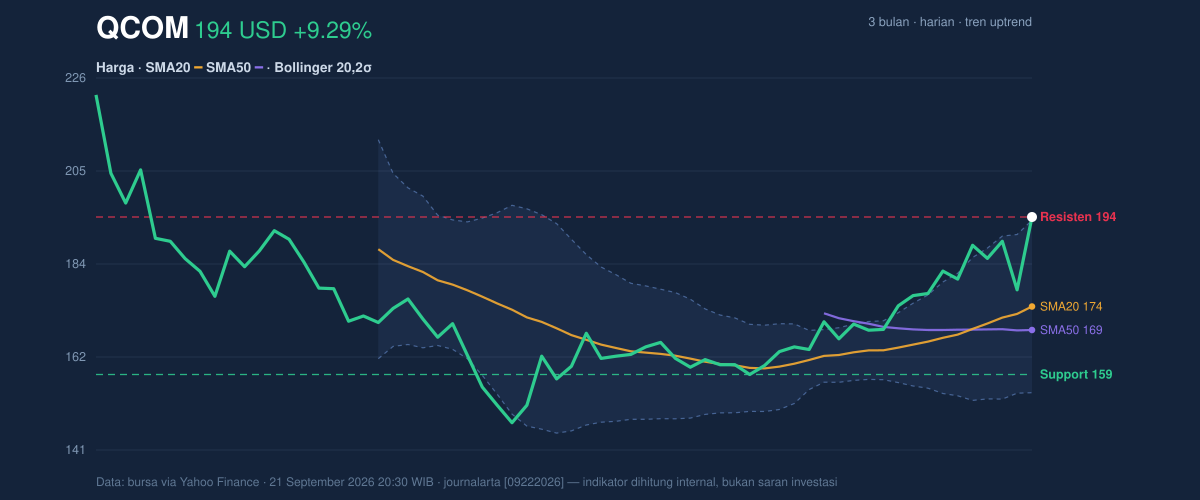
The stock is also sitting at 100% of its 20-hour range, with support at 158.53 and resistance effectively marked by the current price at 194.23. That is a powerful position, but not a relaxed one.
Oscillators & Momentum
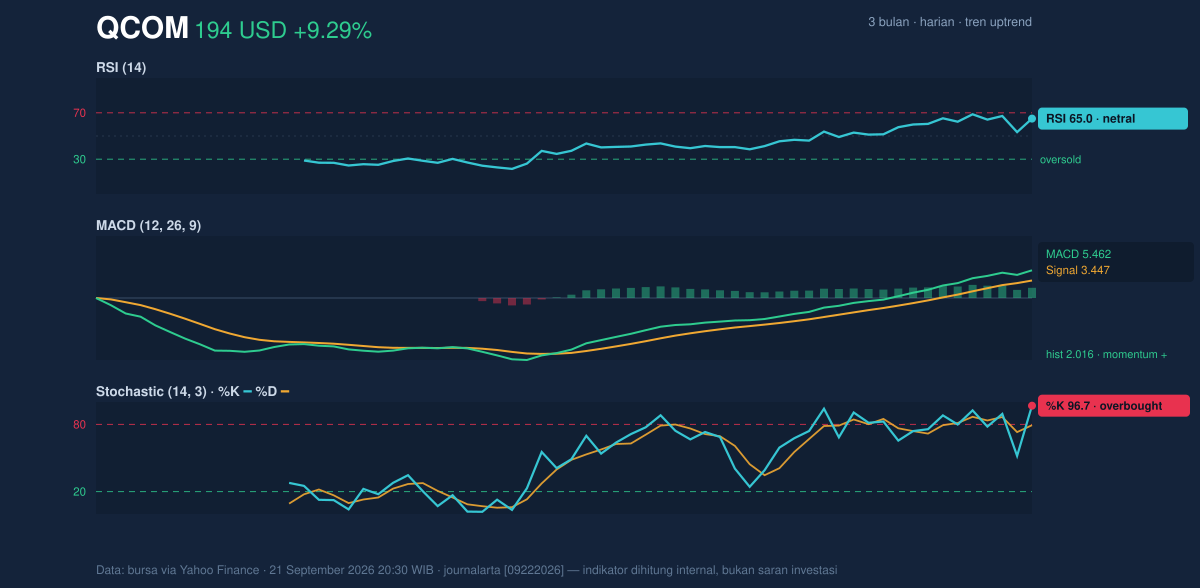
Momentum indicators are split between confirmation and warning. The RSI at 65.0 is still classified as neutral, which means the stock is not yet in the classic overbought zone often associated with readings above 70. That leaves room for the trend to continue. But the Stochastic %K at 96.7 versus %D at 79.3 is clearly overbought, and that matters because stochastic tends to turn earlier than RSI when a move is getting extended. Put simply, it suggests the stock may be rising faster than its recent trading rhythm can comfortably sustain.
The MACD at 5.462, above its signal line at 3.447, with a positive histogram of 2.016, still points to bullish momentum. MACD is useful here because it measures whether the trend is accelerating or fading, and the positive histogram says the move still has energy. So the message from momentum is not “trend over,” but rather “trend strong, yet increasingly stretched.”
Volatility & Volume
Volatility is elevated, and that is one of the clearest signals in the data. The Bollinger Band width of 22.5% shows the bands are expanding, which usually means the market expects bigger price swings ahead. Expansion often accompanies a strong directional move, but it also means entry and exit points can become less forgiving. The ATR(14) of 9.72, equal to 5.0% of price, confirms that daily movement potential is high. For general readers, ATR is a measure of how much a stock typically moves in a session; a higher reading means wider intraday swings and more room for sharp reversals.
Volume supports the breakout-like behavior. Last volume of 18,391,600 was about 1.3× the 20-hour average of 14,526,925, and OBV is rising. OBV, or on-balance volume, tracks whether volume is flowing into the stock on up days or out of it on down days. A rising OBV alongside a rising price suggests the advance is being backed by participation, not just thin trading. That is an important distinction: rallies with volume are usually more credible than rallies built on quiet sessions.
Key Levels & Scenarios
The nearest meaningful floor remains support at 158.53, which is well below current price and defines the broader trend’s lower boundary in the data set. More immediately, the stock is trading above the Bollinger middle band at 173.95, which now acts as the first technical reference point for whether momentum is being maintained or simply peaking. On the upside, the current tape is already testing the 193.49 upper Bollinger band, and the latest print at 194.23 shows price has moved beyond that line.
If Qualcomm holds above the middle band and volume stays firm, the chart remains in trend-extension mode. If it slips back below the upper band and then loses the 173.95 area, that would suggest the move is cooling from an acceleration phase into consolidation. The 3-month high of 233.44 and 3-month low of 142.89 frame the larger range: the stock has recovered strongly from the lower end, but it is still below the prior peak.
Technical Verdict: HOLD (wait & see)
HOLD (wait & see)
- MACD remains positive, so the trend is still supported by momentum.
- Price is above SMA20 and SMA50, with a golden cross confirming the broader structure is constructive.
- Stochastic is overbought and price is above the upper Bollinger band, which raises the odds of near-term cooling or volatility.
Verdict invalidated if price falls below 173.95, because that would mean the stock has lost the Bollinger middle band and the short-term trend anchor.
- Ideal Entry Range: 173.95 to 193.49
- Exit Target: 194.23, then the area above the current high if momentum persists
- Stop Loss protection: 158.53
For non-traders: the chart still points upward, but the stock is stretched enough that patience matters more than chasing the latest spike.
As of 21 September 2026 20:30 WIB, Qualcomm’s 20-hour support stands at 158.53.
Summary Data QCOM
| Last price | 194.23 USD |
| Change 1 day / 5 days / 1 month | 9.29% / 7.82% / 20.83% |
| Trend / MA-cross | uptrend / golden |
| SMA20 / SMA50 | 173.95 / 168.62 |
| RSI (14) / Stochastic %K | 65.0 / 96.7 |
| Bollinger %B / ATR | 102% / 9.72 |
| Support / Resistance 20 days | 158.53 / 194.23 |
| Data as of | 21 September 2026 20:30 WIB |


