QCOM Stock Gains 2.88%, Testing Key Resistance In Focus
On September 14, 2026: price 181.97 USD, trend sideways, RSI 66.1, support 158.53, resistance 181.97. technical analysis of qcom stock.

Qualcomm Inc. climbed to 181.97 USD on NASDAQ, up 2.88% in the latest session, with the move carrying the stock to the top of its recent trading range as investors responded to a firm stretch of price momentum, according to Yahoo Finance data for 11 September 2026. The advance leaves QCOM above both its SMA20 at 166.85 and SMA50 at 168.60, a constructive sign that short-term price action is still trading above its recent average and not merely bouncing from a single volatile session.
Trend & Price Action
The chart shows a stock that is not in a clean breakout trend so much as a strong sideways-to-upward phase: the stated trend is sideways, but the SMA20 slope is rising 1.75% over 5 days, which means the near-term average is tilting higher even if the broader structure has not yet turned into a full trend. That distinction matters. A rising moving average inside a sideways market often signals accumulation rather than a decisive long-term trend, especially when price stays above the shorter average.
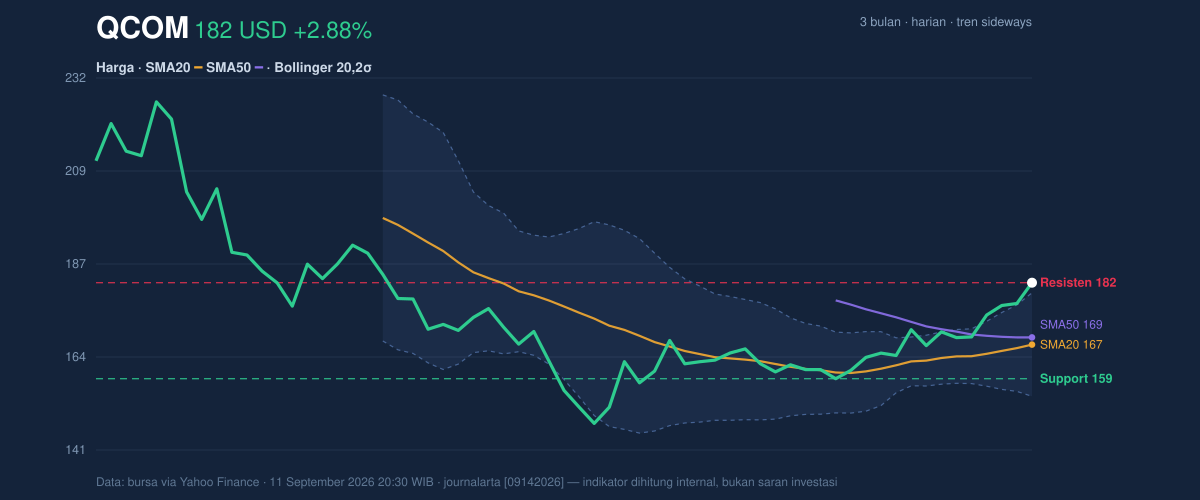
The latest price is also sitting above the Bollinger upper band at 179.49, and the %B reading of 110% shows price has moved beyond the top of the band. In plain language, that usually means the stock is stretching away from its recent mean, which can happen during strong momentum phases but also raises the risk of pause or pullback. The band width at 15.1% is described as normal, so this is not a classic squeeze breakout; instead, it looks like an expansion in price within an otherwise ordinary volatility regime.
The stock is also at the very top of its 20-hour support/resistance range, with support at 158.53 and resistance at 181.97. That means the price is currently testing the ceiling of the recent range rather than trading comfortably inside it.
Short and sharp: this is a test of strength, not a settled breakout.
Oscillators & Momentum
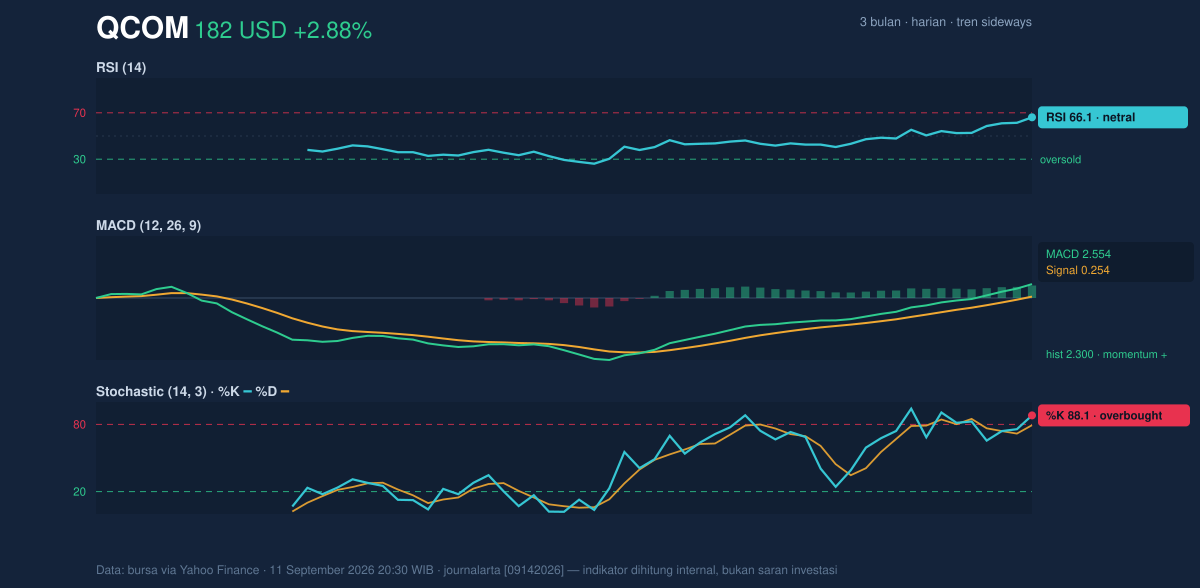
Momentum indicators are mixed in a way that usually matters more than a single “overbought” label. The RSI at 66.1 is described as neutral, which suggests the stock is not yet in a classic exhaustion zone. But the Stochastic %K at 88.1 and %D at 79.3 are both in overbought territory, meaning the latest push has been fast enough to leave price stretched relative to its recent trading rhythm. That often happens when buyers are still in control, but it also means the stock may be more vulnerable to short-term cooling.
The more important confirmation comes from MACD. The MACD at 2.554, well above the signal line at 0.254, with a histogram of 2.300, shows momentum remains firmly positive. In practical terms, MACD is saying the recent rise is still being supported by trend acceleration, even if Stochastic is warning that the move is getting crowded in the short run.
That split is important: RSI is not screaming excess, Stochastic is, and MACD is still supportive.
Volatility & Volume
Volatility is elevated. The ATR(14) at 6.68, equal to 3.7% of price, signals that daily swings are wide enough to create meaningful intraday movement. ATR does not predict direction, but it does tell readers that price can travel farther than usual in either direction. For a stock pressing against resistance, that increases the odds of a decisive move or a sharp rejection.
Volume adds a useful confirmation layer. The last session’s volume of 11,546,600 compared with the 20-day average of 10,948,215 is about 1.1× normal, which indicates participation improved without becoming a blowout surge. That is enough to say the move was not thin or purely technical noise. The OBV is rising, which means on-balance volume is still favoring accumulation rather than distribution. In simpler terms, more volume has been flowing into up days than down days, a constructive sign when price is near resistance.
Key Levels & Scenarios
The main structure is straightforward. 181.97 is the immediate ceiling because it is both the latest price and the top of the stated 20-hour range. Below that, 179.49 is the Bollinger upper band, which now acts as a near-term checkpoint: staying above it suggests momentum remains stretched but alive, while slipping back below it would show the move is losing altitude. The more meaningful downside reference is 158.53, the current support level from the 20-hour range. If price fails to hold that area, the recent advance would look far less convincing.
The 3-month range gives broader context: 233.44 is the recent high and 142.89 the recent low. That places the current price in the upper half of the larger range, but still well below the peak, which suggests QCOM has room to recover further if momentum persists. At the same time, it is far enough above the low that the market has already priced in a substantial rebound.
If the stock can hold above 179.49 and continue to attract volume, the chart would support a continuation attempt. If it slips back under 166.85, the SMA20, that would be an early sign the current push is fading. If 158.53 fails, the short-term structure weakens materially.
Technical Verdict: HOLD (wait & see)
HOLD (wait & see) is the clearest technical read because the stock is strong, but it is also stretched at resistance with overbought short-term signals.
- Reason 1: MACD is strongly positive, with the histogram still wide, which supports the idea that momentum remains intact.
- Reason 2: Stochastic is overbought and price is above the Bollinger upper band, which raises the risk of a pause or pullback.
- Reason 3: Price is at 181.97 resistance and at 110% of Bollinger %B, so the stock is extended rather than comfortably consolidating.
- Invalidation: this verdict is invalidated if price breaks and holds below 158.53.
- Ideal entry range: 166.85 to 179.49
- Exit target: 181.97, with scope toward 233.44 only if resistance is convincingly cleared
- Stop loss protection: 158.53
For non-traders, this means QCOM looks technically healthy, but it is already near a pressure point where the next move needs confirmation, not assumption.
The latest volume was 11,546,600.
Summary Data QCOM
| Last price | 181.97 USD |
| Change 1 day / 5 days / 1 month | 2.88% / 7.95% / 10.43% |
| Trend / MA-cross | sideways / none |
| SMA20 / SMA50 | 166.85 / 168.60 |
| RSI (14) / Stochastic %K | 66.1 / 88.1 |
| Bollinger %B / ATR | 110% / 6.68 |
| Support / Resistance 20 days | 158.53 / 181.97 |
| Data as of | 11 September 2026 20:30 WIB |



