QCOM Stock Technicals: Drops 1.64% on Monday, Death Cross Pressure
On November 2, 2026: price 162.08 USD, trend downtrend, RSI 37.4, support 162.08, resistance 185.41. technical analysis of qcom stock. QCOM Stock Technicals —…

Why QCOM is in focus today
- Closed at a 20-day low (162.08)
- Fresh death cross: SMA20 crossed below SMA50
- Downtrend extending (5-day change -9.76%)
Selected automatically from 100 NASDAQ (US) stocks by a technical-signal score with daily weighted randomisation — not a recommendation.
Trend & Price Action
The price sits below the 20-day simple moving average (SMA) of $175.95 and the 50-day SMA of $177.86. The 20-day average is also falling, down 1.03% over five days. A death cross — the 20-day average moving below the 50-day average — formed one session before the latest session. It signals that recent weakness has become embedded in the trend rather than appearing as a single-day setback. The stock fell 10.35% over one month. It is at the bottom of its 20-day range, between support at $162.08 and resistance at $185.41, while its three-month range spans $142.89 to $205.85. That leaves room for further downside within the broader range, but the three-month low is a separate reference point, not a confirmed floor. The key technical message is that price, moving averages and the recent trend all point down. As shown in the chart, the close is below the lower Bollinger Band, with %B at -12%. A Bollinger reading below zero means the price has moved beneath the band’s usual range; it can reflect forceful selling, but does not by itself establish that a rebound is due.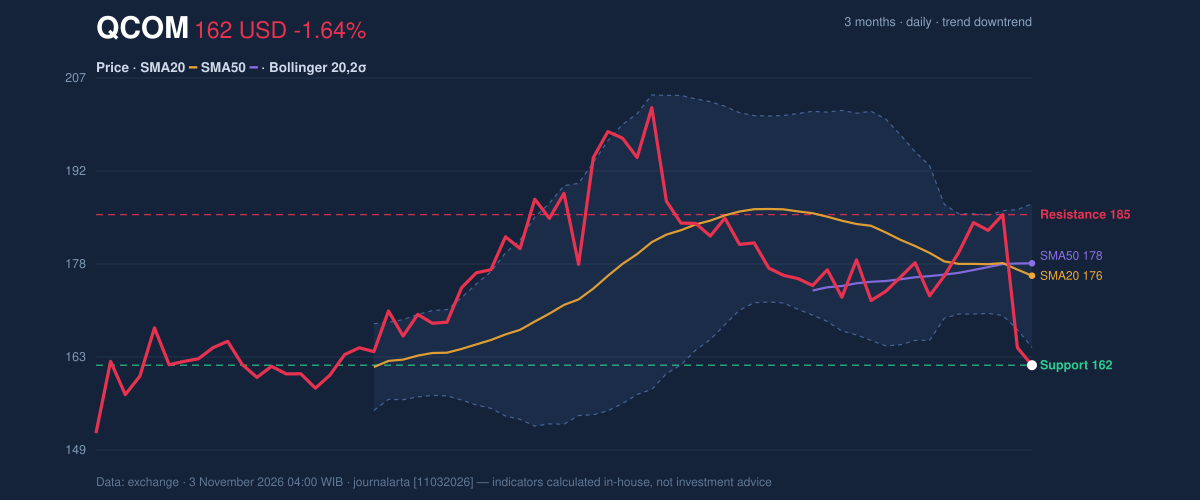
Oscillators & Momentum
The indicators show pressure, but not all in the same way. RSI, a measure of the speed and scale of recent price moves, stands at 37.4 and is classified as neutral in the supplied data. Stochastic %K is 2.6 against %D at 38.1, an oversold reading that suggests the price has dropped sharply relative to its recent range. Oversold conditions can precede a bounce, but are not a reversal signal on their own. The Stochastic is oversold, while MACD momentum remains negative. MACD is -1.714, below its -0.523 signal line, with a -1.191 histogram. The histogram’s negative reading indicates that downside momentum has strengthened relative to the signal line. This helps explain why the extreme Stochastic reading has not yet produced evidence of a broader trend change. The chart below tracks those momentum measures.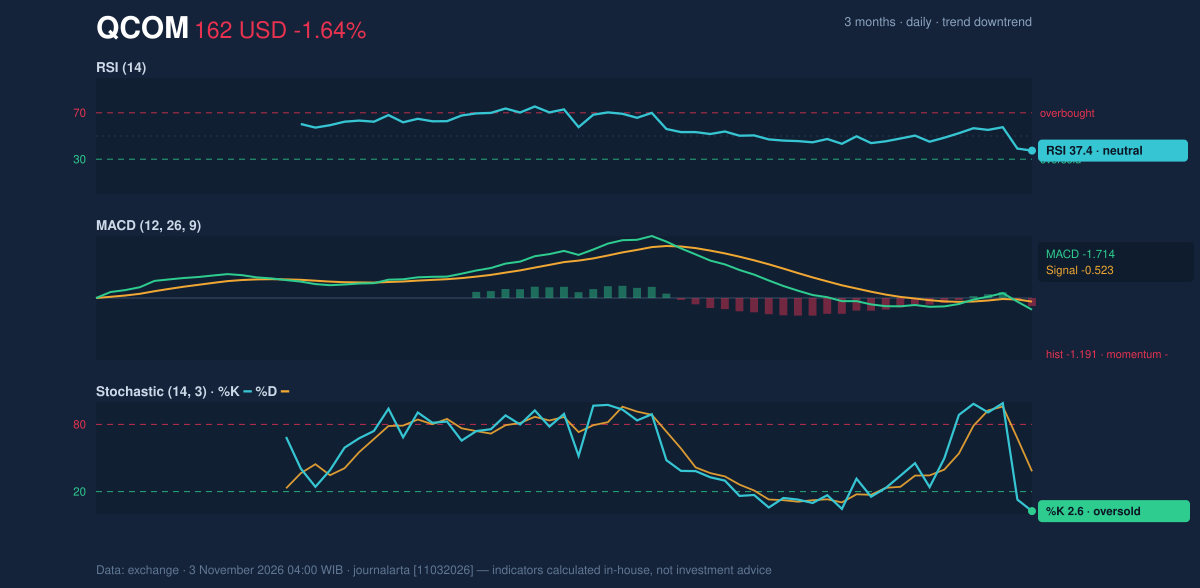
Volatility, Volume & Levels
The Bollinger Band width is 12.6%, described as normal rather than unusually compressed or expanded. That provides no clear signal of an impending volatility breakout. But the average true range (ATR), which estimates typical price movement, is $7.44, or 4.6% of the share price — a high level that makes large daily moves a material feature of the setup. Volume was 10,994,600 shares, about 1.0 times the 20-day average of 10,476,500. Trading was therefore close to normal, not an exceptional surge that would independently confirm capitulation. On-balance volume (OBV), which combines price direction and trading volume to track buying and selling pressure, is falling. That weakens the case that buyers are quietly accumulating shares during the decline. $162.08 is the immediate support reference; $185.41 is the 20-day resistance. A failure to hold support would expose the $142.89 three-month low as the next reference level. A recovery would first need to contend with the declining averages near $176–$178 and then the $185.41 resistance. These are conditional levels, not forecasts.Technical Verdict: SELL
The technical bias is bearish, with three bearish signals and no bullish signals in the supplied assessment. The strongest reasons are the death cross formed one session before the latest session, MACD’s negative histogram of -1.191, and falling OBV. The oversold Stochastic points to potential short-term volatility, but does not outweigh those trend and participation signals. This verdict is invalidated if the price breaks above the $185.41 20-day resistance.- Entry range: $162.08–$173.24, bounded by 20-day support and the supplied price-plus-1.5×ATR reference.
- Exit target: $142.89, the three-month low beyond the 20-day support.
- Stop-loss protection: $185.41, the 20-day resistance.
| Data point | Reading |
|---|---|
| Session | Monday, November 2, 2026 |
| Close | $162.08 |
| One-day / five-day / one-month change | -1.64% / -9.76% / -10.35% |
| 20-day / 50-day SMA | $175.95 / $177.86 |
| 20-day support / resistance | $162.08 / $185.41 |
| Three-month low / high | $142.89 / $205.85 |
Summary Data QCOM
| Last price | 162.08 USD |
| Change 1 day / 5 days / 1 month | -1.64% / -9.76% / -10.35% |
| Trend / MA-cross | downtrend / death |
| SMA20 / SMA50 | 175.95 / 177.86 |
| RSI (14) / Stochastic %K | 37.4 / 2.6 |
| Bollinger %B / ATR | -12% / 7.44 |
| Support / Resistance 20 days | 162.08 / 185.41 |
| Data as of | 3 November 2026 04:00 WIB |
Disclaimer: This technical analysis is generated automatically from exchange data and indicators calculated by JournalArta, for information and education only. The verdict and the entry, target and stop-loss levels are not investment advice or a solicitation to buy or sell any security. Investment decisions and their risks rest solely with the reader.
Track QCOM stock price daily: live levels, support/resistance and our full QCOM analysis history.