Momentum Gains, COST Stock Gains 2.93% Today
On September 28, 2026: price 922.77 USD, trend sideways, RSI 52.3, support 893.74, resistance 945.47. technical analysis of cost stock.

Costco Wholesale Corp. shares rose on the Nasdaq on 25 September 2026, with COST last trading at 922.77 USD, up 2.93% on the day, as a burst of volume met a market that is still trying to decide whether the stock is stabilising above short-term support or merely pausing inside a wider sideways pattern.
The move matters because it came with participation, not just a thin bounce. Trading volume reached 4,629,300, about 2.0× the 20-day average, while OBV — on-balance volume, a running tally that rises when volume tends to favour up days — is also rising. That combination usually signals that buyers are not just present; they are active enough to force the tape higher. Yet the broader structure is not a clean breakout. The stock remains in a sideways trend, and the 20-day moving average is still sloping lower at -1.34% over five days. In plain language, recent buying has improved the short-term tone, but the medium-term chart has not fully turned.
Trend & Price Action
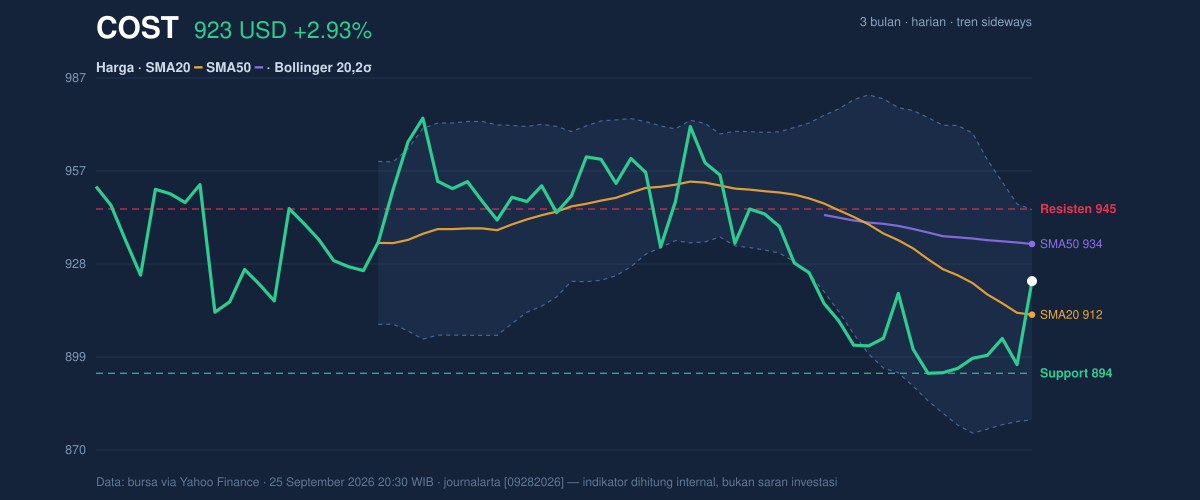
As shown in the chart, COST is trading above the SMA20 at 912.20 but still below the SMA50 at 934.45. That positioning is important: above the short average means the latest bounce has enough strength to reclaim near-term momentum, while below the longer average means the stock has not yet proven that the recovery can extend into a more durable trend. There is no new MA-cross, so the chart does not yet show the kind of moving-average alignment that usually confirms a fresh directional phase.
The stock is also sitting in the upper half of its recent range, at about 56% of the 20-day support-resistance band between 893.74 and 945.47. That is constructive, but not decisive. It says Costco has recovered from the lower part of the range, yet it is still approaching an area where sellers have already shown up. The 3-month high at 987.55 and low at 883.10 frame the bigger picture: the share price is well off the lows, but still materially below the peak.
The chart is leaning better, but it has not turned cleanly bullish.
Oscillators & Momentum
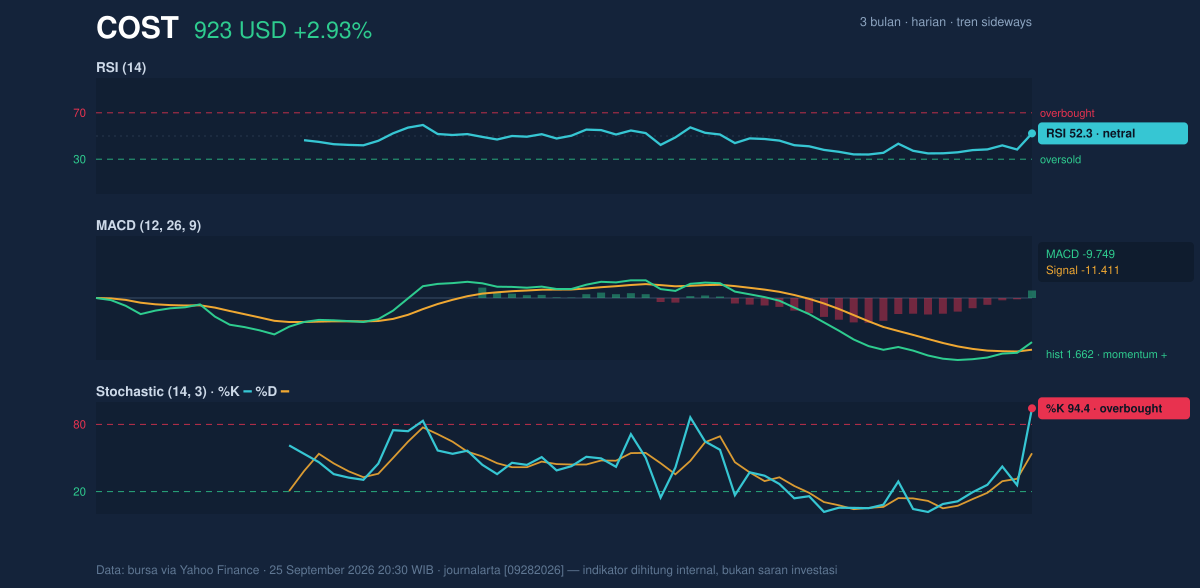
The momentum picture is mixed, and that is the key signal. RSI at 52.3 is neutral, which means the stock is neither stretched nor washed out. In other words, the market is not warning of exhaustion from a deep rally, but it is also not signalling a deeply oversold rebound that would typically invite stronger mean reversion.
The more interesting divergence comes from the stochastic oscillator: %K at 94.4 versus %D at 54.2. Stochastic is a faster gauge of where price sits within its recent range, and a reading above 80 is commonly treated as overbought. Here, the fast line is deeply elevated, which suggests the recent advance has moved quickly and may be vulnerable to cooling or consolidation. That does not automatically mean a reversal is coming; rather, it often means the stock has become more sensitive to any loss of follow-through.
At the same time, the MACD setup is supportive. MACD at -9.749 remains below zero, so the broader momentum backdrop is not fully positive yet, but the histogram at 1.662 and the fact that MACD is above the signal line at -11.411 indicate improving internal momentum. Put simply: the trend is still repairing from weakness, and the repair is gaining traction.
That is why the chart looks stronger than the trend label alone suggests.
Volatility & Volume
Volatility is subdued. ATR at 13.72, equal to about 1.5% of price, points to relatively low day-to-day movement. Low ATR often means the market is waiting for a catalyst or a decisive test of resistance. The Bollinger Bands reinforce that idea: the band width is only 7.3% and is narrowing, a classic squeeze pattern that can precede a larger move. With %B at 66%, price is trading above the middle band at 912.20 but not yet near the upper band at 945.28. That places COST in a constructive but not overheated zone.
The squeeze matters because it says the market has compressed. Compressed charts often do not stay quiet for long. The direction of the next expansion will likely depend on whether buyers can push through the nearby ceiling or whether the stock slips back toward the middle band and support.
Key Levels & Scenarios
The immediate resistance cluster is tight: 945.28 on the Bollinger upper band and 945.47 on 20-day resistance are nearly identical. That makes the area a meaningful test. If COST can clear that zone and hold above it, the chart would begin to shift from recovery mode toward a more convincing breakout attempt. On the downside, 912.20 is the first important support because it is both the SMA20 and the Bollinger middle band. A failure there would suggest the bounce is losing shape. Below that, 893.74 is the next support to watch, and then 879.12 at the lower Bollinger band becomes the broader downside reference.
The signal is simple: above the ceiling, momentum can extend; below the middle band, the recent bounce starts to lose credibility.
Technical Verdict: HOLD (wait & see)
HOLD (wait & see)
- MACD is improving and the histogram is positive, which supports the rebound.
- Volume is 2.0× average and OBV is rising, showing real participation behind the move.
- Stochastic is overbought at 94.4, while price is still below SMA50 at 934.45, so upside confirmation is not complete.
Verdict invalidated if price falls below 893.74, which would break the nearest support and weaken the current recovery structure.
- Ideal entry range: 912.20 to 922.77
- Exit target: 945.28 to 945.47
- Stop loss protection: 893.74, with deeper chart risk toward 879.12
For non-traders: Costco’s chart is improving, but it still needs to prove that the latest bounce can survive the next test at resistance.
Summary Data COST
| Last price | 922.77 USD |
| Change 1 day / 5 days / 1 month | 2.93% / 3.07% / -1.27% |
| Trend / MA-cross | sideways / none |
| SMA20 / SMA50 | 912.20 / 934.45 |
| RSI (14) / Stochastic %K | 52.3 / 94.4 |
| Bollinger %B / ATR | 66% / 13.72 |
| Support / Resistance 20 days | 893.74 / 945.47 |
| Data as of | 25 September 2026 20:30 WIB |

