HSBC Stock Technicals Today: Gains 0.80%, Momentum Weakens
On Agustus 14, 2026: price 163.00 HKD, trend uptrend, RSI 55.6, support 156.50, resistance 168.20. technical analysis of hsbc stock. HSBC Stock Technicals —…

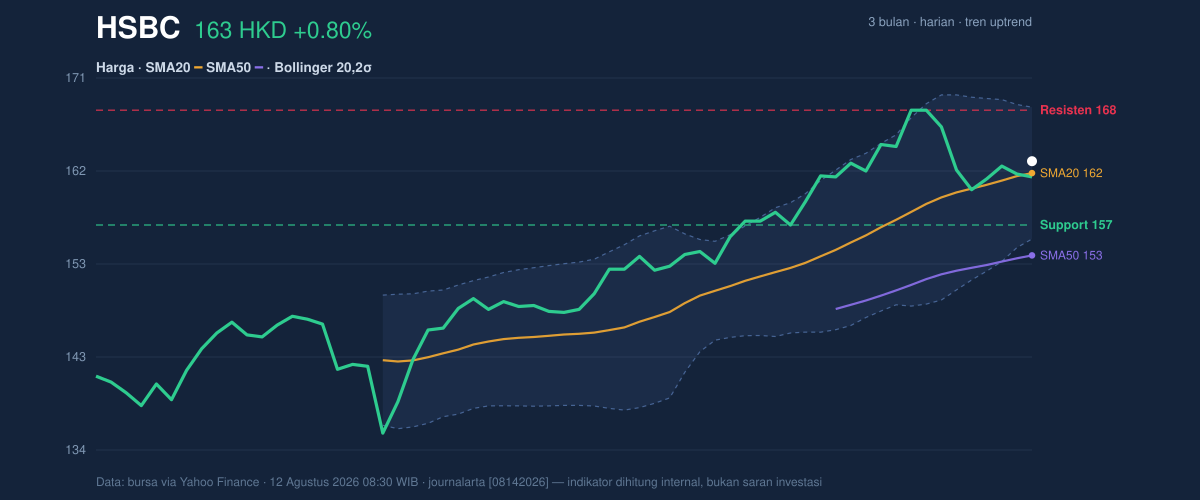
HSBC Holdings rose to 163.00 HKD in Hong Kong trading, up 0.80% from the previous close of 161.70, with the shares now sitting above both the short-term average and the middle of the Bollinger band. That positioning matters: it says the stock is still in an uptrend, but the latest move is not yet backed by the kind of momentum or volume that usually confirms a stronger breakout. As shown in the chart, HSBC is advancing inside a broad, already-established range rather than accelerating away from it.
Trend & Price Action
The broader trend remains constructive. The stock is above SMA20 at 161.79 and well above SMA50 at 153.41, which is the classic sign of a medium-term bullish structure. The SMA20 is rising at 1.23% over 5 days, so the short-term trend is still pointing higher. Just as important, there is no fresh MA-cross, meaning the market is not getting a new trend signal from moving averages; instead, it is extending an existing one. That often implies the trend is healthy, but not necessarily gaining speed.
The price is also trading in the upper half of the recent range, at about 56% of the 20-day band, which indicates buyers have regained some control after earlier weakness. But the stock is still below the upper Bollinger band at 168.51, leaving room for further upside only if momentum improves. The 3-month high at 169.70 is the obvious ceiling in view, while the 3-month low at 133.50 shows how far the stock has already recovered from its deeper base.
Price is firm, but not yet stretched.
Oscillators & Momentum
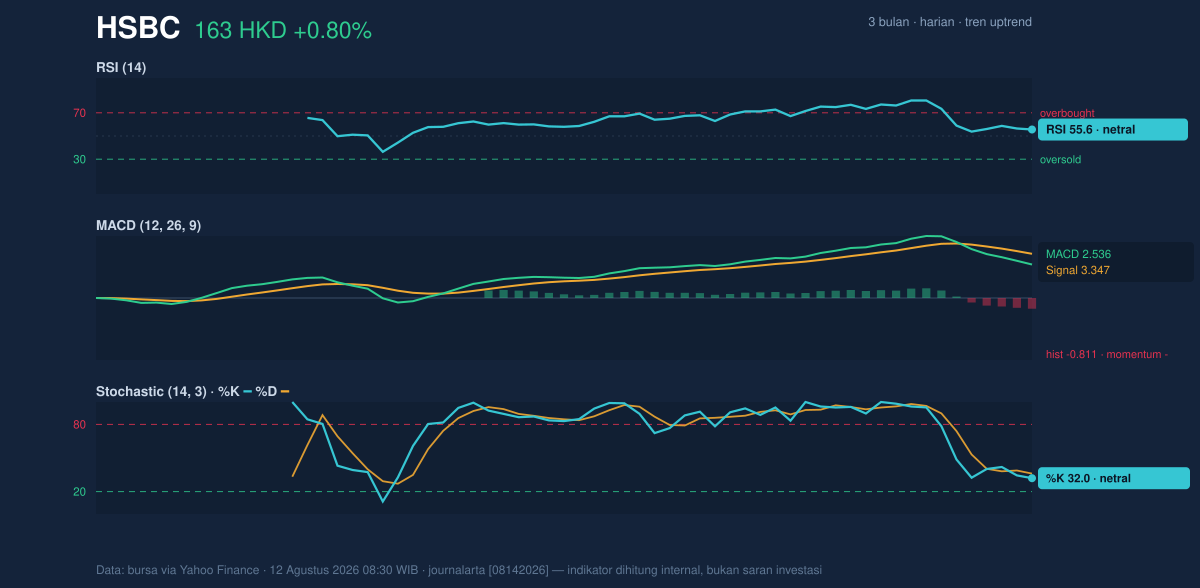
The momentum picture is more cautious than the trend picture. RSI at 55.6 is neutral, which means the stock is neither overbought nor oversold and still has room to move either way. The Stochastic %K at 32.0 and %D at 36.1 also sit in neutral territory, but they are leaning lower than the RSI would suggest, hinting that the latest bounce is not fully confirmed by short-term impulse. As shown in the chart, the oscillators are not flashing a reversal warning, but they are also not signaling a strong acceleration.
The clearest caution comes from MACD. MACD at 2.536 is below the signal line at 3.347, leaving a histogram of -0.811. In plain terms, the trend is still up, but the pace of that trend has slowed enough for momentum to turn negative in the near term. That kind of setup often appears when a stock is pausing inside an uptrend rather than starting a fresh leg higher. It is not a bearish breakdown signal by itself; it is a warning that follow-through has to be earned.
RSI is neutral, Stochastic is neutral, but MACD is negative.
Volatility & Volume
Volatility is contained rather than explosive. The Bollinger band width is 8.3%, described as normal, and the stock’s %B reading of 59% places price slightly above the middle of the band, not near the extremes. That usually means the market is balanced: there is enough buying to keep the trend alive, but not enough pressure to force a decisive expansion. The ATR at 2.99, equal to 1.8% of price, reinforces that message. ATR measures average daily movement; at this level, the stock is moving enough to matter, but not enough to suggest a volatile breakout environment.
Volume is the bigger weakness. Last turnover of 7,210,163 was only 0.5× the 20-day average of 14,985,798, and OBV is falling. OBV, or on-balance volume, tracks whether trading volume is flowing with price or against it. A falling OBV while price holds up can mean buyers are advancing without broad participation. That does not negate the trend, but it does reduce confidence in the move. For a stock trading near the top half of its range, thin volume can leave rallies vulnerable to fading if sellers appear.
Bollinger is normal, ATR is moderate, but volume is weak.
Key Levels & Scenarios
The nearest support is 156.50, which is the 20-day support level and the first line that should matter if the stock loses short-term traction. Below that, the rising SMA20 at 161.79 is now more of a pivot than a ceiling: holding above it keeps the trend intact, while slipping back under it would suggest the recent advance is losing grip. On the upside, 168.20 is the nearest resistance, with the upper Bollinger band at 168.51 and the 3-month high at 169.70 forming a tight cluster of overhead supply. That cluster matters because it is where short-term traders often take profit and where a breakout needs confirmation.
If price clears 168.20 and stays above the upper band, the chart would be signaling renewed expansion rather than just range trading. If it fails there and slips back toward 156.50, the message would be that the rally is still intact in trend terms but lacking conviction. The current setup is therefore less about a dramatic breakout and more about whether HSBC can convert a mild uptrend into a stronger one.
Resistance is tight at 168.20 to 169.70; support is defined at 156.50.
Technical Verdict: HOLD (wait & see)
HOLD (wait & see) fits best because the stock is still above SMA20 and SMA50, but the signal mix is uneven: MACD is negative, volume is only 0.5× average, and OBV is declining. The trend is up, yet the participation behind it is soft, which makes the current move look more like a pause than a confirmed breakout. The nearest upside test sits at 168.20, while the first meaningful support is 156.50.
- Entry Range: 156.50 to 161.79, where support and the SMA20 sit close together
- Exit Target: 168.20 to 169.70, aligned with resistance, the upper Bollinger band, and the 3-month high
- Stop Loss protection: below 156.50, where the 20-day support would fail
The chart says HSBC is still trending higher, but it has not yet proven that the next move will be strong enough to break the ceiling at 168.20.
Next support level to watch: 156.50.
Summary Data HSBC
| Last price | 163.00 HKD |
| Change 1 day / 5 days / 1 month | 0.80% / 0.56% / 4.96% |
| Trend / MA-cross | uptrend / none |
| SMA20 / SMA50 | 161.79 / 153.41 |
| RSI (14) / Stochastic %K | 55.6 / 32.0 |
| Bollinger %B / ATR | 59% / 2.99 |
| Support / Resistance 20 days | 156.50 / 168.20 |
| Data as of | 12 Agustus 2026 08:30 WIB |
