Shell Stock Drops 2.03% Today, Momentum Weakens
On Agustus 14, 2026: price 3,288.00 GBp, trend sideways, RSI 57.0, support 3,160.00, resistance 3,405.50. technical analysis of shell stock.

Shell plc traded lower on the London Stock Exchange on 12 August 2026, with Shell’s last price at 3,288.00 GBp, down from 3,356.00 and leaving the shares just below their short-term trend line. The move matters because it came despite a still-positive one-month gain of 5.06%, which suggests the market is not in a clear downtrend so much as pausing after a rebound. In plain terms, investors are still willing to own the stock, but they are not yet paying up aggressively for it.
Trend & Price Action
The chart shows a share price that is sitting in a sideways pattern rather than a clean directional run. Shell is trading below its SMA20 at 3,296.28, but well above its SMA50 at 3,148.60, which usually signals a market that has cooled from recent strength without damaging the broader intermediate trend. That positioning matters: the shorter average is acting as a near-term ceiling, while the longer average still acts as a cushion underneath.
There is no fresh MA cross, so the chart is not flashing a new trend-change signal. Instead, the market is waiting for confirmation. The 20-day Bollinger setup reinforces that view: the middle band sits at 3,296.28, almost exactly where the price is hovering, while the upper band is 3,408.54 and the lower band is 3,184.01. With the bands narrowing and the width at 6.8%, volatility is compressing, which often precedes a sharper move once the price escapes the range. That is why the current drift matters more than the daily percentage change alone.
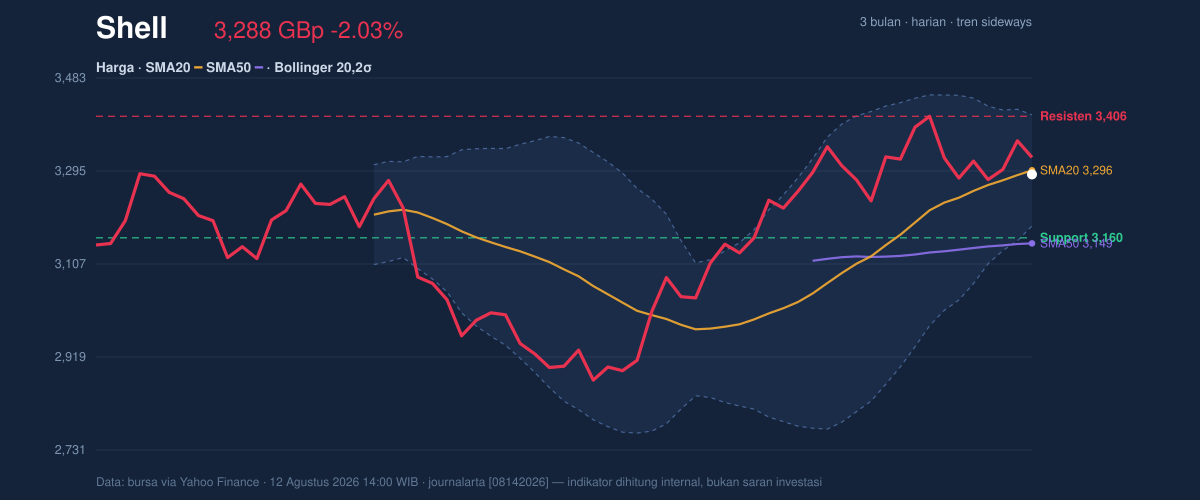
The stock is also sitting at 52% of its 20-day range, with support at 3,160.00 and resistance at 3,405.50. That midpoint location is important because it tells us the market is neither oversold nor overextended; it is balanced, waiting for a catalyst. The 3-month range, from 2,559.50 to 3,758.50, shows there is still plenty of room on either side if the compression resolves into a breakout or breakdown.
Oscillators & Momentum
Momentum indicators are not confirming an immediate directional push. RSI at 57.0 is neutral, which means Shell is not stretched enough to suggest an overbought pullback, but it is also not weak enough to imply capitulation. Stochastic %K at 47.7 and %D at 49.3 are also neutral, sitting close together and pointing to a market without a strong short-term impulse.
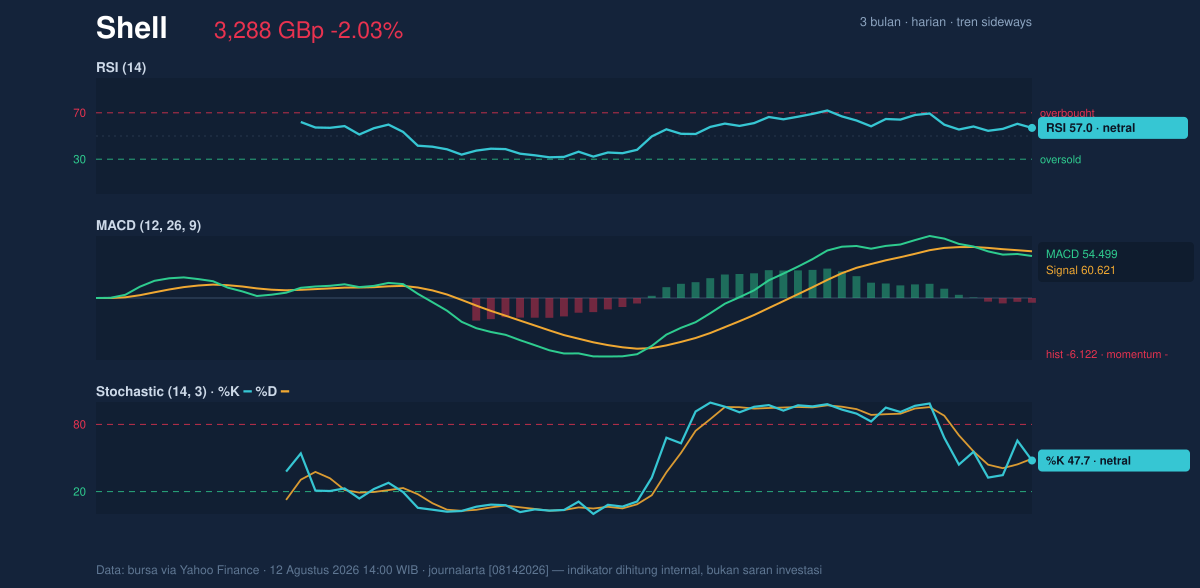
The more cautionary signal comes from MACD. MACD at 54.499 is below the signal line at 60.621, and the histogram at -6.122 shows that downside momentum is currently stronger than the trend component. That does not automatically mean a larger fall is underway, but it does mean the recent bounce has lost some traction. In other words, the price can still hold its range, yet the momentum engine is not currently accelerating in the bulls’ favour.
Volatility & Volume
The volatility backdrop is moderate rather than explosive. ATR at 72.20, equal to 2.2% of price, indicates the stock is moving enough to matter day to day, but not in a disorderly way. Combined with the narrowing Bollinger bands, that suggests the next meaningful move could come from a relatively contained base rather than a chaotic spike.
Volume gives a mixed read. Last turnover of 8,902,749 was only 1.1 times the 20-day average of 8,420,046, so the latest decline was not accompanied by a dramatic surge in trading activity. That weakens the case for a forceful bearish break. Yet OBV is falling, which implies that, over time, more volume has been associated with down days than up days. This is the subtle warning in the tape: the stock is not under panic selling, but participation has tilted a little more negative than the price alone suggests.
Key Levels & Scenarios
The immediate market map is straightforward. 3,160.00 is the first support to watch, because it sits below the current price but above the 50-day average, making it the line where short-term weakness starts to threaten the broader constructive structure. On the upside, 3,405.50 is the first resistance, closely aligned with the upper Bollinger band at 3,408.54. A move through that zone would tell the market has absorbed recent selling and is escaping the squeeze.
If Shell fails to hold the 3,160.00 area, the chart would start to point back toward the lower half of the 3-month range, where sentiment could cool more sharply. If it clears 3,405.50, the compressed band structure implies the move could extend more quickly than recent trading has implied. Right now, the price is too central to call either outcome dominant.
Technical Verdict: HOLD (wait & see)
HOLD (wait & see)
- RSI 57.0 and Stochastic 47.7/49.3 are neutral, so momentum is not strong enough to justify a directional conviction.
- MACD is below its signal line with a -6.122 histogram, which argues for caution even though the broader trend remains sideways.
- Price is below SMA20 but above SMA50, while the Bollinger band is squeezing, which usually means the stock is waiting for confirmation rather than already trending.
- Verdict invalidated if price breaks below 3,160.00, because that would weaken the current support structure and raise the risk of a deeper move.
- Ideal Entry Range: 3,184.01 to 3,296.28
- Exit Target (Target Price): 3,405.50 to 3,408.54
- Stop Loss protection: below 3,160.00
In plain English, Shell looks like a stock that is pausing near the middle of its lane, and the next move matters more than the current drift. “The market is waiting for proof.”
Summary Data Shell
| Last price | 3,288.00 GBp |
| Change 1 day / 5 days / 1 month | -2.03% / 0.23% / 5.06% |
| Trend / MA-cross | sideways / none |
| SMA20 / SMA50 | 3,296.28 / 3,148.60 |
| RSI (14) / Stochastic %K | 57.0 / 47.7 |
| Bollinger %B / ATR | 46% / 72.20 |
| Support / Resistance 20 days | 3,160.00 / 3,405.50 |
| Data as of | 12 Agustus 2026 14:00 WIB |

