AIA Stock Drops 2.96%, Testing Support Level In Focus
On Agustus 17, 2026: price 70.40 HKD, trend sideways, RSI 31.1, support 70.40, resistance 79.65. technical analysis of aia stock. AIA Stock Drops — full…

AIA Group slipped to 70.40 HKD, down 2.96% on the day, and the move matters because it pushed the stock to the very bottom of its recent trading band, as shown in the chart. The shares are now below both key moving averages, with price under the SMA20 at 76.19 and SMA50 at 74.61, a configuration that usually signals sellers still control the tape even when the broader pattern is only sideways. The latest drop also leaves AIA just above the 3-month low of 69.05, which makes the current level more than a routine dip: it is a test of whether the stock can hold a floor or whether it is starting to reprice lower.
Trend & Price Action
The chart shows a stock that has lost upward momentum and is now trading in the lower edge of its range. The sideways trend is important because it suggests this is not yet a clean downtrend with a decisive breakdown, but the slope of SMA20 at -0.74% over 5 days shows the near-term bias has weakened. In plain terms, the short-term average is leaning down, so recent trading has been softer than the broader range would imply.
What stands out is the relationship between price and the Bollinger band structure. With the lower band at 70.90 and the stock at 70.40, AIA is trading slightly below the band floor. That usually means price has stretched to the downside faster than normal, not that a rebound is guaranteed. The %B of -5% reinforces that point: the stock is not just near support, it is trading beyond the lower volatility envelope, which often reflects short-term stress or an overshoot in selling.
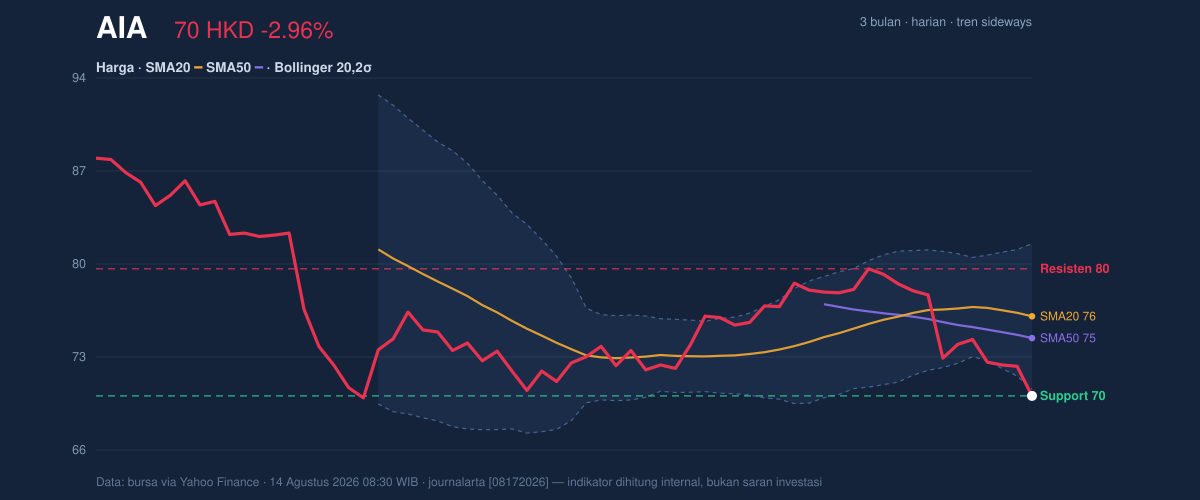
The 20-hour support at 70.40 is now the key line on the chart because price closed right on it. That makes the next session critical. If the stock can stabilize above this area, the recent move may remain a shakeout inside a range. If it cannot, the market will be looking toward the 3-month low of 69.05 as the next reference point.
Oscillators & Momentum
The momentum picture is mixed, and that mix is what makes this name interesting right now. The RSI(14) at 31.1 sits near oversold territory but is still described as neutral in the data, which means the stock is weak without yet flashing a full reversal signal. That matters because RSI near 30 often tells traders that downside pressure is becoming stretched, but it does not by itself mean the decline is over.
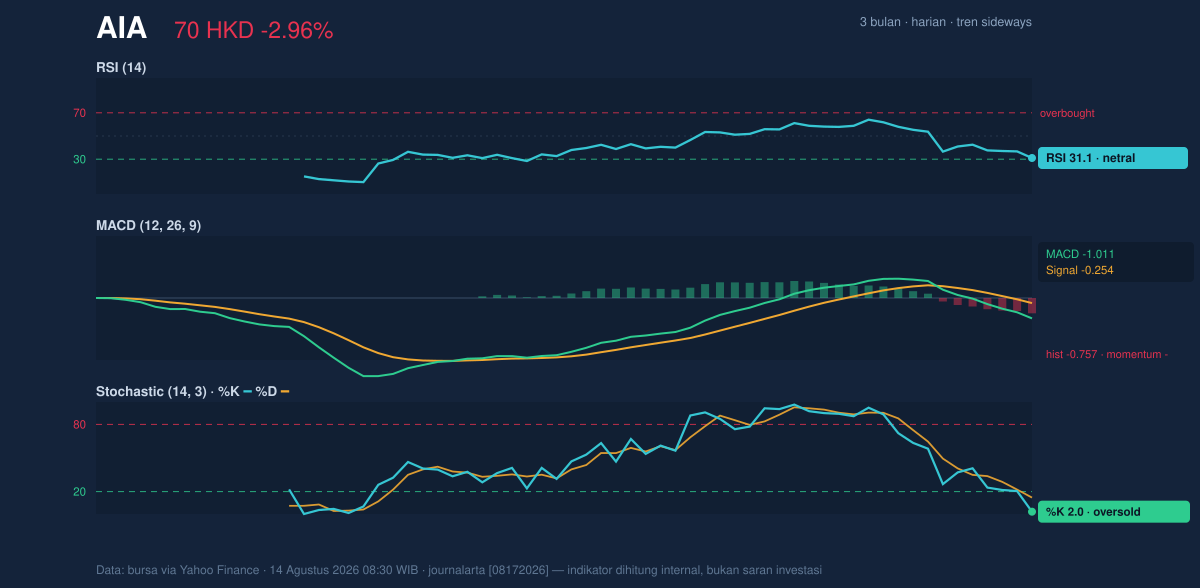
The clearer warning comes from the Stochastic %K at 2.0 and %D at 14.6, which is firmly oversold. Stochastic measures where the close sits within the recent range, so a reading this low says AIA has been closing near the bottom of its short-term range repeatedly. That is a sign of persistent selling, but it can also precede a bounce if the stock stops making fresh lows.
The MACD at -1.011, with the signal line at -0.254 and histogram at -0.757, is the most bearish element in the setup. MACD below the signal line and below zero means downside momentum is still active, not just a one-day washout. In other words, the oscillators are not aligned: Stochastic says the stock is stretched, but MACD says the trend has not yet turned.
Volatility & Volume
Volatility is not elevated enough to suggest panic, but it is high enough to keep the move meaningful. The ATR(14) of 2.10, equal to 3.0% of price, points to moderate daily movement. That is important because a stock with this kind of ATR can move through support or resistance quickly if order flow shifts.
Volume adds a useful clue. Last trading volume was 39,252,330, about 1.4× the 20-day average of 27,921,851. Higher volume on a down day usually means the move had real participation rather than thin trading. The fact that OBV is falling supports that interpretation: on-balance volume tracks whether money is flowing in or out, and a decline suggests distribution rather than quiet consolidation.
That combination — heavier volume, falling OBV, and price below the moving averages — says the recent weakness is being confirmed by participation. It is not just a chart artifact.
Key Levels & Scenarios
The immediate range is narrow but loaded. The stock is sitting at the 20-hour support of 70.40, with the next visible ceiling at 79.65. That is a wide gap, which tells you the market has not yet built a tight recovery structure. The Bollinger middle line at 76.19 and the SMA50 at 74.61 sit between current price and resistance, so any recovery would first need to reclaim those levels before the chart can improve.
If AIA holds 70.40 and momentum starts to stabilize, the first technical checkpoint is the 70.90 lower Bollinger band, then the SMA50 at 74.61, and then the SMA20 at 76.19. If it fails to hold 70.40, the market is likely to focus on the 69.05 3-month low as the next downside marker. That is the level where the current range stops looking like support and starts looking like a breakdown test.
Technical Verdict: HOLD (wait & see)
HOLD (wait & see) fits the chart because the stock is oversold but still under pressure.
- MACD is negative, and the histogram remains below zero, which says downside momentum is still active.
- Stochastic is oversold and RSI is near 31.1, which raises the chance of a short-term bounce but does not confirm one.
- Price is below SMA20 and SMA50, while OBV is falling, showing that recent weakness has been confirmed by volume.
Verdict invalidated if price breaks below 69.05.
- Ideal Entry Range: 70.40 to 70.90, only if price stabilizes above support and reclaims the lower Bollinger band.
- Exit Target: 74.61 first, then 76.19 if momentum improves.
- Stop Loss protection: below 69.05, the 3-month low.
For non-traders, this means the stock is weak now, but it has reached a level where the next move could be either a bounce or a deeper slip.
Summary Data AIA
| Last price | 70.40 HKD |
| Change 1 day / 5 days / 1 month | -2.96% / -5.06% / -6.82% |
| Trend / MA-cross | sideways / none |
| SMA20 / SMA50 | 76.19 / 74.61 |
| RSI (14) / Stochastic %K | 31.1 / 2.0 |
| Bollinger %B / ATR | -5% / 2.10 |
| Support / Resistance 20 days | 70.40 / 79.65 |
| Data as of | 14 Agustus 2026 08:30 WIB |


