Alibaba Stock Drops 1.64% Today, Momentum Weakens
On Agustus 17, 2026: price 119.90 HKD, trend uptrend, RSI 52.7, support 110.00, resistance 128.10. technical analysis of alibaba stock.

Alibaba Group’s Hong Kong-listed shares fell to HKD 119.90 on 14 August 2026, down 1.64% from the previous close, even as the stock remains in a broader uptrend and is trading just above its short-term trend line, according to Yahoo Finance data for 9988.HK. The move matters because it shows a market that is still willing to price Alibaba above its SMA20 at HKD 119.13 and well above its SMA50 at HKD 111.31, but is no longer showing the clean upside momentum that usually accompanies a fresh advance. In plain terms: the trend is still constructive, yet the latest pullback says buyers are less aggressive than they were a few sessions ago.
Trend & Price Action
The chart shows Alibaba sitting in the upper half of its recent trading band, but not near the top of it. With the price at HKD 119.90 against support at HKD 110.00 and resistance at HKD 128.10, the stock is positioned around 55% of the 20-hour range. That placement suggests the market has not broken down, but neither has it forced a decisive test of the ceiling. The broader structure still leans positive: the SMA20 is rising at 2.28% over five days, and price remains above both the SMA20 and SMA50. That combination usually signals a trend that is intact, though not accelerating.
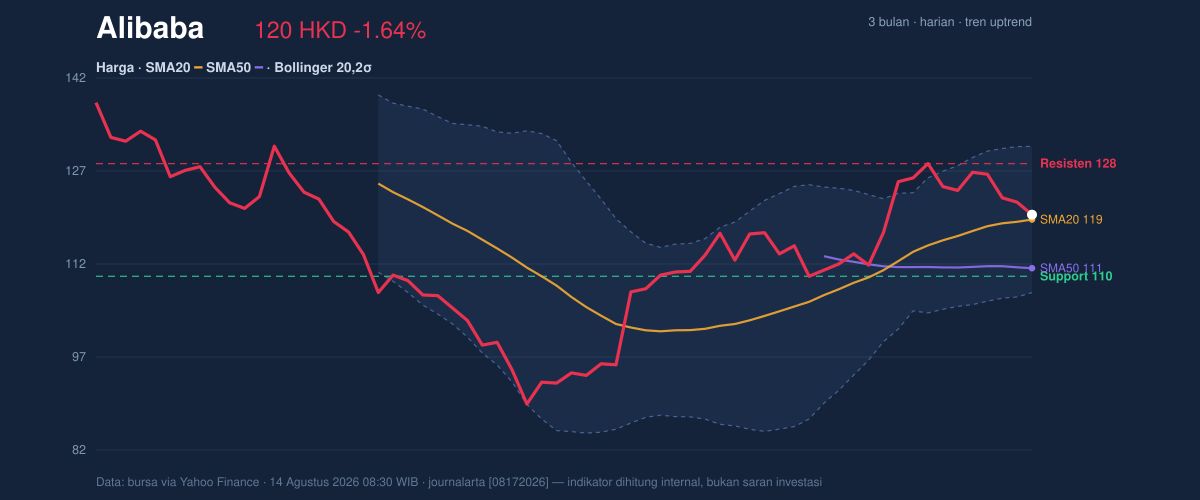
The absence of a new moving-average crossover is also telling. A “golden cross” or “death cross” is when a shorter average moves above or below a longer one; no fresh cross means the market is relying on existing trend support rather than a new technical catalyst. That often leaves the stock more sensitive to short-term sentiment.
A trend that is intact is not the same as a trend that is strong.
Oscillators & Momentum
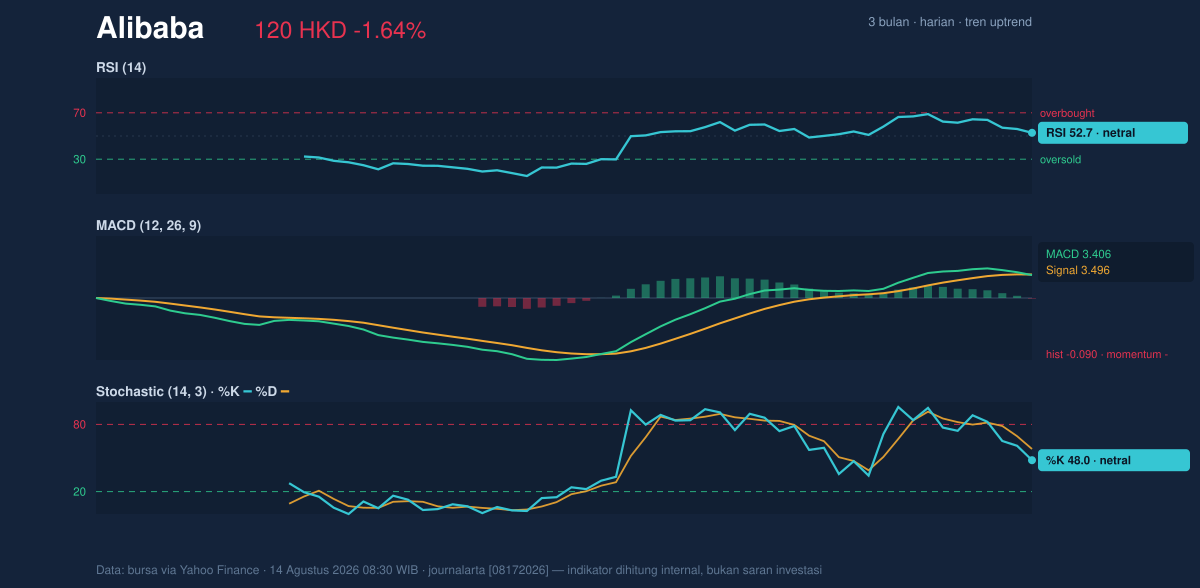
The momentum picture is more mixed than the price chart. RSI at 52.7 is neutral, which means the stock is neither overbought nor oversold. That matters because neutral RSI in an uptrend often implies room to move either way, depending on whether buyers return with conviction. But the other oscillators are less reassuring: Stochastic %K at 48.0 and %D at 58.0 also sit in neutral territory, while the MACD at 3.406 is below its signal line at 3.496 and the histogram is -0.090. MACD is a trend-following momentum gauge; when it slips below the signal line, it typically means upward momentum is fading even if the price has not yet rolled over.
That divergence is important. The stock can still hold its uptrend while momentum cools, but if price fails to reclaim short-term strength, the chart can transition from pause to correction. As shown in the momentum chart, the indicators are not flashing panic — they are warning that the advance needs fresh participation.
Volatility & Volume
Volatility remains elevated. The ATR(14) is 4.58, or 3.8% of price, which means daily swings are still large enough to matter. ATR, or average true range, is a measure of how much a stock typically moves; a higher reading suggests wider intraday and short-term fluctuations. For Alibaba, that means a move of a few Hong Kong dollars in either direction is still normal behavior, not necessarily a signal of a new trend.
Bollinger Bands reinforce that message. The price sits near the middle band at HKD 119.13, with the upper band at HKD 130.87 and the lower band at HKD 107.38. The %B reading of 53% says the stock is slightly above the midpoint of the band structure, while the 19.7% band width is described as normal rather than compressed. In simple terms, the market is not in a volatility squeeze that would often precede a sharp breakout; it is in a steadier regime where direction still needs confirmation.
Volume adds a subtle but meaningful twist. Last volume was 56,905,091, about 0.6x the 20-hour average of 89,752,763. That is not the kind of participation usually seen when a stock is launching a decisive move through resistance. Yet OBV is rising, which indicates that cumulative volume flow is still tilting positive over time. So the market is not abandoning the name; it is just not showing urgency in the latest session.
Key Levels & Scenarios
The immediate technical map is straightforward. HKD 110.00 is the clearest near-term support, while HKD 128.10 is the first obvious resistance. The wider 3-month range, from HKD 88.65 to HKD 144.00, shows that Alibaba still has room to move inside a broad corridor, but the nearer levels matter more for traders watching the current tape.
If the stock can push through HKD 128.10 with stronger volume, the chart would begin to look more constructive, especially if MACD turns back above its signal line and RSI rises from neutral. If, instead, price slips below HKD 119.13 and then loses HKD 110.00, the short-term uptrend would start to look vulnerable, with the lower Bollinger band at HKD 107.38 becoming the next technical reference.
The signal is balanced, but not equally balanced across all indicators.
Technical Verdict: HOLD (wait & see)
HOLD (wait & see)
- Price remains above SMA20 and SMA50, so the broader trend is still intact.
- MACD is negative versus its signal line, showing momentum has weakened even though the trend has not broken.
- Volume is only 0.6x normal, which reduces confidence in any immediate breakout attempt toward resistance.
Verdict invalidated if price breaks HKD 110.00.
- Ideal Entry Range: HKD 110.00 to HKD 119.13
- Exit Target: HKD 128.10
- Stop Loss protection: below HKD 107.38
For non-traders, this means Alibaba’s chart is still holding up, but the next move needs proof before the market can treat the rebound as durable.
The latest 3-month high is HKD 144.00.
Summary Data Alibaba
| Last price | 119.90 HKD |
| Change 1 day / 5 days / 1 month | -1.64% / -3.15% / 6.48% |
| Trend / MA-cross | uptrend / none |
| SMA20 / SMA50 | 119.13 / 111.31 |
| RSI (14) / Stochastic %K | 52.7 / 48.0 |
| Bollinger %B / ATR | 53% / 4.58 |
| Support / Resistance 20 days | 110.00 / 128.10 |
| Data as of | 14 Agustus 2026 08:30 WIB |

