DBS Momentum Weakens: Stock Drops 1.27% (Agustus 17, 2026)
On Agustus 17, 2026: price 75.53 SGD, trend uptrend, RSI 62.3, support 71.90, resistance 76.99. technical analysis of dbs stock. DBS Momentum Weakens — full…

DBS Group’s shares slipped to 75.53 SGD from 76.50 on the last close, but the broader setup still leans upward: the stock remains above its SMA20 at 74.40 and well clear of its SMA50 at 69.68, while the 20-day slope is rising at 1.53% over 5 days. That matters because it shows the pullback is happening inside an established advance, not after a breakdown. As shown in the chart, price is sitting in the upper part of its recent range, with a 20-hour support at 71.90 and resistance at 76.99, leaving DBS close to the area where buyers and sellers have recently disagreed most.
Trend & Price Action
The trend structure is still constructive. A price above the short-term average and a much higher gap over the longer average usually tells traders that the medium-term base has already been repaired and that the market is paying more for the stock than it did a few weeks ago. In plain language, DBS is not fighting the trend; it is moving within it. The absence of a fresh MA-cross also matters: there is no new moving-average signal forcing a dramatic re-rating either way, which keeps the picture steady rather than explosive.
The recent move, however, is not one-way. DBS has gained 4.21% over one month, but only 0.60% over five days, while the latest session fell 1.27%. That combination suggests momentum has cooled after a run-up, yet the stock has not lost its underlying structure. The chart shows price trading at about 71% of the recent range, which is a sign it is still leaning toward the upper half of the band rather than drifting into weakness.
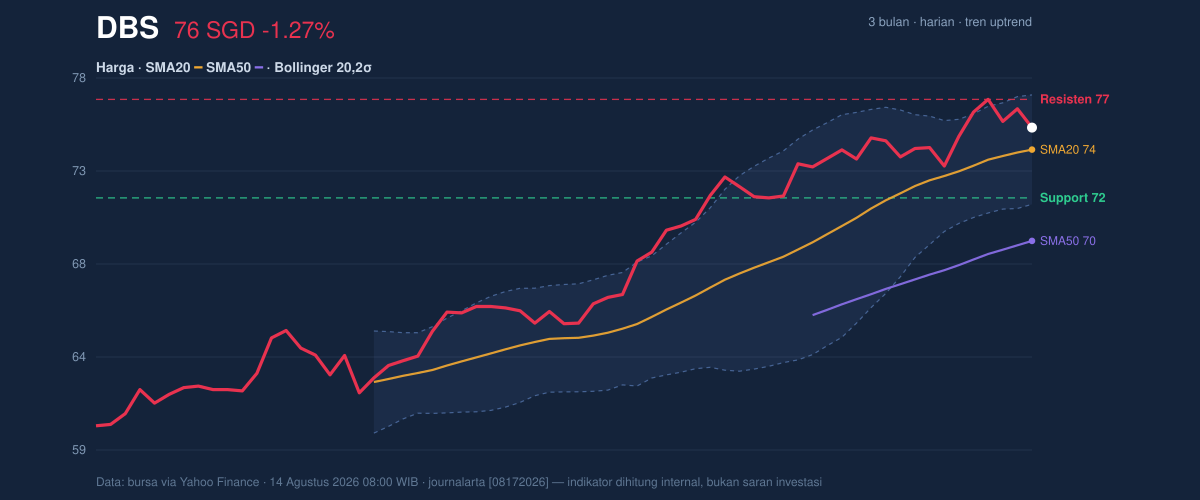
The key question is whether DBS can keep holding above the short-term pivot area. If it does, the market can continue treating the dip as pause rather than reversal. If it does not, the tone changes quickly.
Oscillators & Momentum
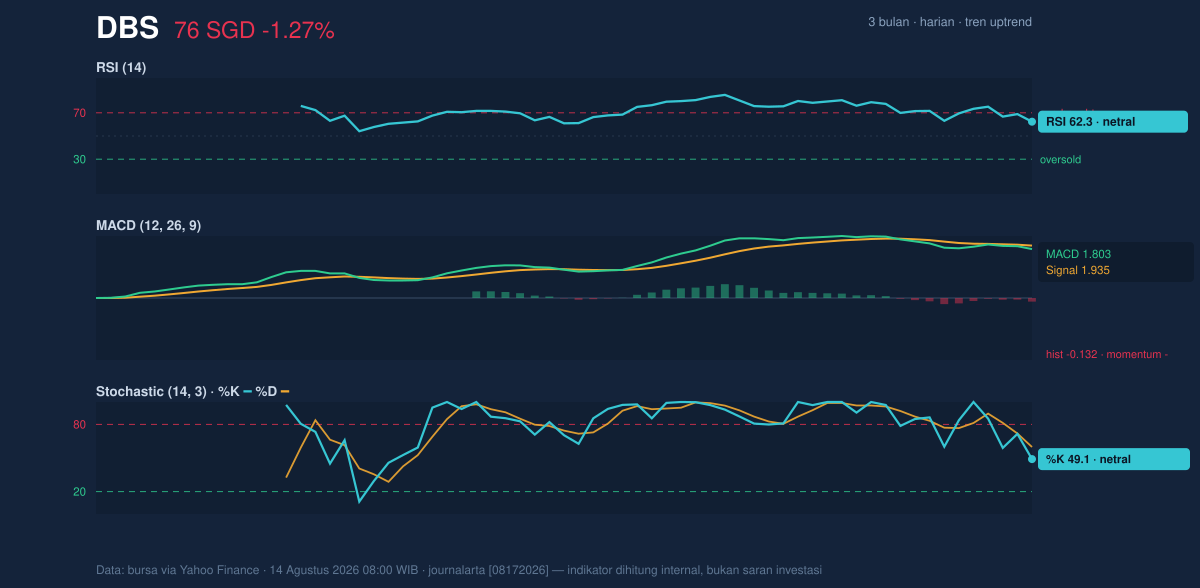
The momentum tools are more mixed than the trend tools. RSI at 62.3 is neutral-to-firm, which means the stock is neither stretched enough to scream overbought nor weak enough to signal washed-out selling. That is usually a healthy place for an uptrend to pause: there is room for further advance, but not much evidence of urgency.
The stochastic reading is also neutral, with %K at 49.1 and %D at 59.9. When the fast line sits below the slower line, it often points to short-term momentum fading before price itself fully rolls over. In other words, the market is no longer accelerating upward, even if the broader trend remains intact.
The more cautionary signal comes from MACD. With MACD at 1.803 below the signal at 1.935 and a -0.132 histogram, momentum has turned negative in the near term. That does not automatically mean the trend is broken; it means the stock is losing thrust while still above key averages. For investors and traders reading the chart, that is the classic “uptrend, but not with conviction” profile.
Volatility & Volume
Volatility is not spiking. The ATR at 1.28, or about 1.7% of price, points to moderate daily movement, which usually means the stock is not in a panic phase. More interesting is the Bollinger setup: the upper band sits at 77.22, the middle at 74.40, and the lower at 71.57, while the band width has narrowed to 7.6%. A squeeze like this often signals a market coiling for a larger move, because calm periods tend to precede expansion. The current %B at 70% shows price is still above the midpoint and closer to the upper band than the lower one, which keeps the bias constructive even as momentum softens.
Volume confirms that the latest move is not hollow. The last session’s volume of 5,077,557 was about 1.0× the 20-day average of 4,985,030, so participation was roughly normal rather than exaggerated. That is important: the selloff was not accompanied by a surge in panic trading. Meanwhile, OBV is rising, which suggests net buying pressure has still been building over time even if the most recent momentum readings have cooled.
Key Levels & Scenarios
The market is now boxed between nearby support and resistance. The 20-hour support at 71.90 sits just above the lower Bollinger band at 71.57, making that zone the first real test of whether the pullback remains orderly. On the upside, 76.99 is the immediate ceiling, with the 77.22 Bollinger upper band and the 77.97 three-month high forming a tight overhead cluster. That cluster matters because breakouts often stall when several reference points sit close together.
If DBS holds above 71.90, the chart keeps its bullish structure and leaves room for a retest of 76.99 and then the 77.22 to 77.97 zone. If it loses 71.90, the market would be signaling that the current squeeze is resolving downward rather than upward, and the next reference becomes the lower Bollinger band at 71.57. The stock is not far from either outcome, which is exactly why the coming sessions matter.
Technical Verdict: HOLD (wait & see)
HOLD (wait & see) fits the current setup because the trend is still positive, but near-term momentum has weakened and price is sitting just below a nearby resistance cluster.
- Reason 1: Trend remains intact — price is above the SMA20 at 74.40 and SMA50 at 69.68, with the short-term slope still rising.
- Reason 2: Momentum is mixed — MACD is negative versus its signal line, while RSI at 62.3 and stochastic remain neutral.
- Reason 3: Volatility is compressing — the Bollinger band squeeze at 7.6% suggests a move is building, but direction is not confirmed.
- Invalidation condition: this verdict is invalidated if price falls below 71.90.
- Ideal Entry Range: 71.90 to 74.40
- Exit Target (Target Price): 76.99 to 77.22
- Stop Loss protection: below 71.57
For non-traders: DBS is still in an uptrend, but the next move depends on whether it can hold its floor or slips into a deeper pullback.
“The stock is coiled, but the chart is still deciding which way to spring.”
Summary Data DBS
| Last price | 75.53 SGD |
| Change 1 day / 5 days / 1 month | -1.27% / 0.60% / 4.21% |
| Trend / MA-cross | uptrend / none |
| SMA20 / SMA50 | 74.40 / 69.68 |
| RSI (14) / Stochastic %K | 62.3 / 49.1 |
| Bollinger %B / ATR | 70% / 1.28 |
| Support / Resistance 20 days | 71.90 / 76.99 |
| Data as of | 14 Agustus 2026 08:00 WIB |


