DIS Stock Analysis: Gains 1.96%, Golden Cross Formed
On Agustus 17, 2026: price 106.85 USD, trend uptrend, RSI 67.6, support 92.83, resistance 106.85. technical analysis of dis stock. DIS Stock Analysis — full…

Walt Disney shares closed at 106.85 USD on 14 August 2026, up 1.96% on the day and 9.40% over the past month, as the stock pushed back to the top of its recent range. The move matters less as a simple one-day gain than as a test of whether Disney can keep trading above its short-term trend after a steady climb: the price is now above both key moving averages, and the chart shows a market that is leaning bullish but also getting stretched.
Trend & Price Action
Disney is in an uptrend, with the SMA20 at 99.59 and the SMA50 at 99.19. More importantly, the golden cross — where the 20-day average moves above the 50-day average — tells traders that recent momentum has improved enough to overtake the medium-term trend. That is not a guarantee of further gains, but it is a classic sign that buyers have been in control long enough to change the market’s bias.
The stock is also trading above the SMA20, and the SMA20 itself is rising at 1.80% over 5 days. In plain language, the short-term trend is still pointing upward rather than flattening out. As shown in the chart, Disney is sitting near the upper edge of its recent band, which often means the market is rewarding momentum — but also that fresh buyers are paying close attention to whether the move can continue without a pause.
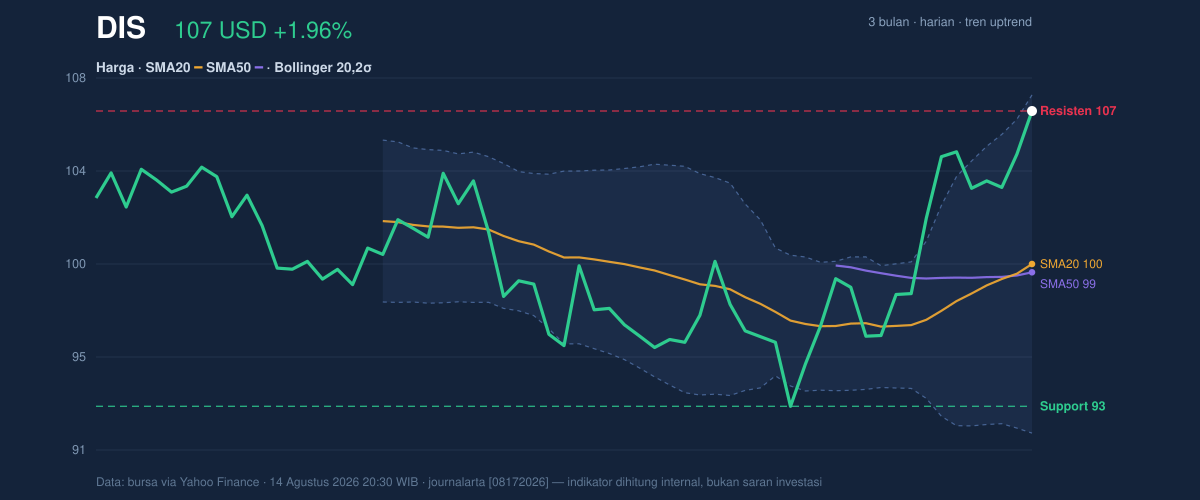
The practical message from the price structure is simple: strength is intact, but the stock is no longer cheap within its own short-term range.
Oscillators & Momentum
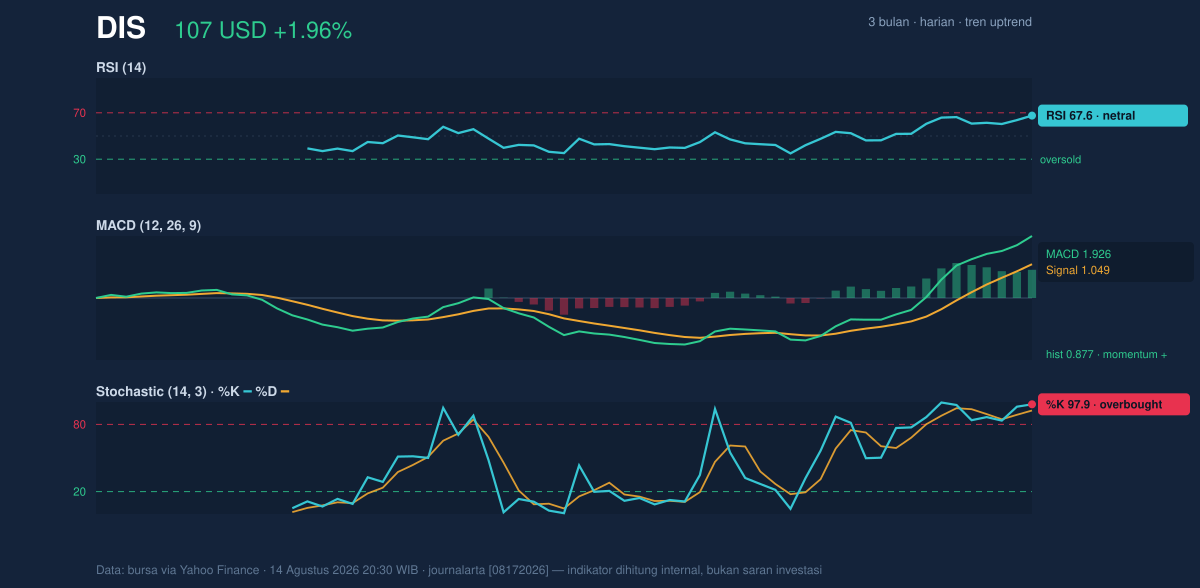
The momentum picture is mixed in a way that usually appears late in an advance. RSI at 67.6 is still technically in neutral territory, but it is close enough to the overbought zone to suggest the stock has lost some of its room to run before traders start asking whether the move is becoming crowded. By contrast, the Stochastic %K at 97.9 and %D at 92.4 are clearly overbought, which means the stock is trading near the top of its recent price range and could be due for a pause even if the broader trend remains upward.
That is the key distinction: overbought does not mean broken. It means the stock has moved quickly enough that the next stretch higher may need fresh catalysts rather than just momentum carrying it forward. The MACD at 1.926, above its signal line at 1.049 with a positive histogram of 0.877, confirms that trend momentum is still supportive. In other words, the oscillator setup is not flashing a reversal; it is saying the rally is still alive, but increasingly extended.
As shown in the chart, Disney’s momentum is strong enough to stay constructive, but not calm enough to ignore.
Volatility & Volume
The Bollinger Bands help explain where that tension sits. With the upper band at 107.61, middle band at 99.59, and lower band at 91.56, Disney is trading with a %B of 95%, meaning the price is pressing very close to the upper boundary of its normal volatility envelope. The band width of 16.1% is described as normal, so this is not a volatility explosion; it is a controlled advance that has simply reached the upper end of its lane. That often leaves the stock vulnerable to consolidation, because there is less statistical room before it hits resistance created by the band itself.
Volume adds a cautionary note. The latest trade volume of 8,172,300 was only 0.7x normal versus the 20-day average of 11,563,345. That means the breakout-style price action is not being backed by unusually heavy participation. Still, OBV is rising, which matters because on-balance volume tracks whether money is generally flowing into the stock over time. Rising OBV alongside a higher price suggests accumulation is still present, even if the most recent session did not bring a surge of turnover.
The signal here is not “weakness”; it is “verification is incomplete.”
Key Levels & Scenarios
The nearest reference point is the current resistance at 106.85, which is also the latest closing price. That makes the market’s immediate task obvious: it must prove that this level is not just a temporary ceiling. Above that, the 3-month high at 107.11 and the Bollinger upper band at 107.61 form the next visible ceiling. If Disney can move through that zone, the chart would be showing a cleaner breakout from the recent range.
On the downside, the 20-day support at 92.83 and the 3-month low at 92.49 define the area where the trend would start to look damaged. Because the stock is currently at the 100% range mark, any failure to hold near current levels could trigger a sharper retreat than the day-to-day move suggests. The ATR at 2.26, or 2.1% of price, says a typical daily swing is still meaningful enough that a pullback could arrive quickly if momentum cools.
Technical Verdict: HOLD (wait & see)
HOLD (wait & see) is the clearest read from the chart because Disney is in a confirmed uptrend, but it is also stretched near resistance and showing overbought short-term momentum.
- Reason 1: The golden cross and price above the SMA20 keep the trend constructive.
- Reason 2: The MACD is positive, so momentum still supports the advance.
- Reason 3: The Stochastic is overbought and price sits near the upper Bollinger band, which raises the odds of consolidation.
- Invalidation: This verdict is invalidated if price falls below 92.83, where near-term support gives way.
- Ideal Entry Range: 99.59 to 102.00
- Exit Target: 107.11 to 107.61
- Stop Loss protection: 92.83
In plain English: Disney still looks strong, but the chart says the easy part of the move may already be behind it.
“The stock is still climbing, but it is now close enough to the ceiling that every next step has to prove itself.”
Summary Data DIS
| Last price | 106.85 USD |
| Change 1 day / 5 days / 1 month | 1.96% / 1.85% / 9.40% |
| Trend / MA-cross | uptrend / golden |
| SMA20 / SMA50 | 99.59 / 99.19 |
| RSI (14) / Stochastic %K | 67.6 / 97.9 |
| Bollinger %B / ATR | 95% / 2.26 |
| Support / Resistance 20 days | 92.83 / 106.85 |
| Data as of | 14 Agustus 2026 20:30 WIB |


