HSBC Stock Analysis: Drops 1.35%, Momentum Weakens
On Agustus 17, 2026: price 160.80 HKD, trend sideways, RSI 53.0, support 156.50, resistance 168.20. technical analysis of hsbc stock. HSBC Stock Analysis —…

HSBC Holdings closed at 160.80 HKD, down 1.35% on the day and sitting below its 20-day average of 162.29 even as the broader setup remains sideways. That combination matters: the share price is not in a clean uptrend, but it is also not breaking down decisively, with the stock still holding well above the 50-day average of 154.00. As shown in the chart, HSBC is trading in the middle of its recent band, at roughly 37% of the 20-day range, which tells readers the market is waiting for a catalyst rather than committing to a direction.
Trend & Price Action
The price structure is best described as range-bound with a mild positive tilt over the medium term. The sideways trend label fits the data: the SMA20 is rising at 1.06% over 5 days, but the share price remains below the SMA20, which usually means short-term momentum has cooled before it can fully confirm a breakout. The absence of a fresh MA-cross also matters. A moving-average crossover is often read as a trend signal, so no new cross suggests the stock has not yet produced a decisive shift in direction. The recent move from the 3-month high of 169.70 to the current level leaves HSBC below the top of its range, while still comfortably above the 3-month low of 133.50.
The chart also shows a tighter trading envelope than a few weeks ago.
Oscillators & Momentum
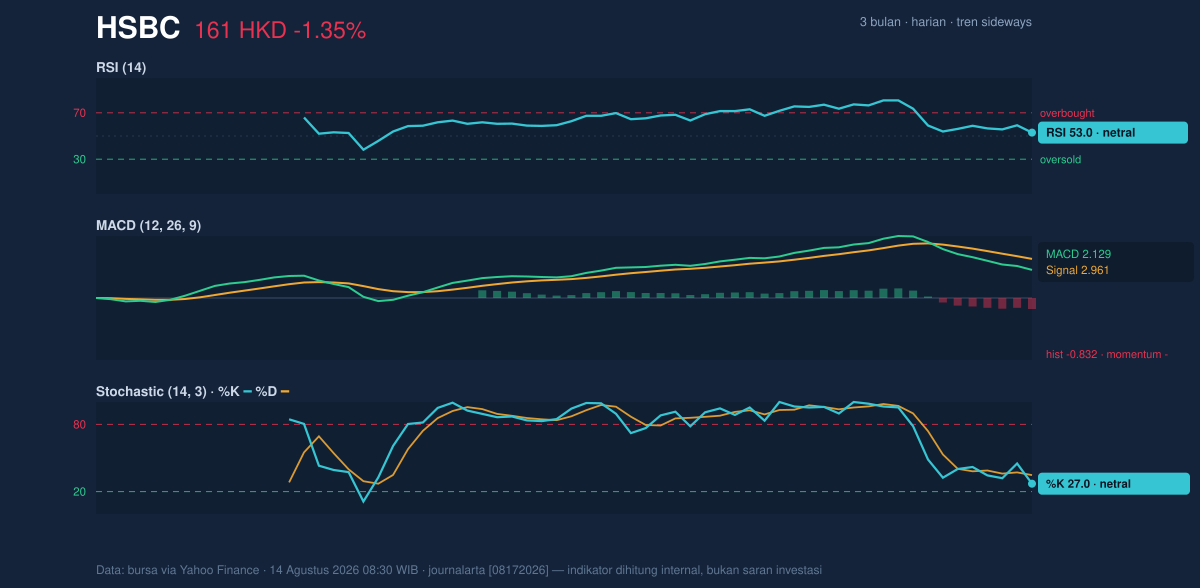
Momentum indicators are mixed, which is exactly what a sideways market tends to produce. The RSI at 53.0 is neutral, meaning the stock is neither stretched on the upside nor oversold on the downside. That is important because a neutral RSI often reflects balance rather than conviction. The Stochastic %K at 27.0 and %D at 34.7 sits near the lower end of its scale, but still in neutral territory, suggesting near-term price pressure has eased without yet flashing a clear reversal. In plain language, the oscillator setup says the stock has lost some short-term speed, but not enough to imply panic selling.
The more cautionary signal comes from the MACD. With MACD at 2.129 below its signal line at 2.961, and a histogram of -0.832, the momentum trend is negative. The histogram measures the gap between MACD and signal; when it is below zero, it usually means the recent pace of price movement is weaker than the underlying trend. So while RSI and Stochastic are steady, MACD is warning that upside follow-through has not yet taken hold.
That split between neutral oscillators and negative MACD is a classic wait-and-watch pattern.
Volatility & Volume
The Bollinger Bands add an important layer to the story. The upper band is 168.21, the middle band is 162.29, and the lower band is 156.37. HSBC is trading with %B at 37%, which places the price in the lower half of the band structure but not close enough to the bottom to be considered oversold. More telling is the 7.3% band width, which is narrowing. A squeeze like this often precedes a sharper move, because compressed volatility tends to release into expansion. The question is direction, and the current indicators do not yet settle that question.
Volatility is present, but participation is not strong. ATR(14) at 2.93, or 1.8% of price, indicates moderate daily movement potential, enough for a meaningful swing but not enough to imply disorderly trading. Yet volume weakens the case for an immediate breakout: last volume was 6,724,838, only 0.5x the 20-day average of 14,143,220, and OBV is down. On-Balance Volume tracks whether volume is flowing into or out of the stock; a falling OBV suggests sellers have had the upper hand in aggregate, even if the price has not cracked support. That is a caution flag when a stock is trying to move out of a squeeze.
Low volume inside a narrowing band usually means the market is waiting, not agreeing.
Key Levels & Scenarios
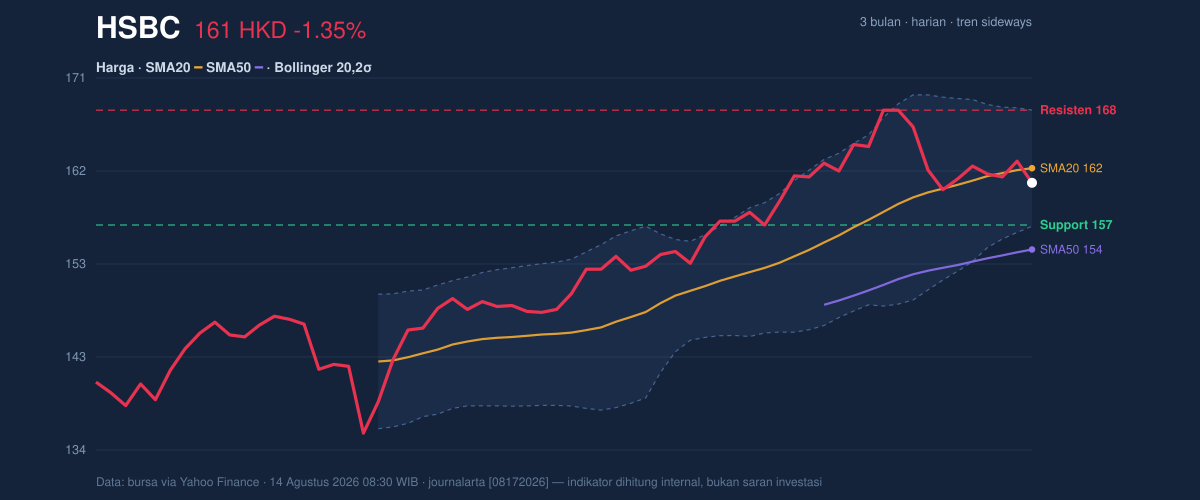
The immediate reference points are clear. Support at 156.50 is close to the lower Bollinger band at 156.37, which makes that area technically important: if it holds, the stock can continue to trade inside the current range. If it fails, the next message from the chart would be that the squeeze has resolved downward. On the upside, resistance at 168.20 sits just under the upper Bollinger band at 168.21, making that zone the first real test for any recovery attempt. A move through that area would signal that the recent weakness is being absorbed and that the stock is trying to revisit the 3-month high of 169.70.
Because HSBC is below the SMA20 at 162.29 but above the SMA50 at 154.00, the chart is balanced between short-term softness and medium-term stability. That is why the next decisive move matters more than the latest daily change.
Technical Verdict: HOLD (wait & see)
HOLD (wait & see) fits the current setup because the stock is caught between a neutral RSI, a negative MACD histogram, and a Bollinger squeeze that could resolve either way. The price is still below the SMA20, which keeps short-term momentum from turning fully constructive, while volume at 0.5x average and a downward OBV argue against treating the current move as confirmed accumulation. The verdict would be invalidated if price falls below 156.50, because that would break the nearest support and the lower edge of the current range.
- Ideal Entry Range: 156.50 to 162.29
- Exit Target (Target Price): 168.20 to 169.70
- Stop Loss protection: below 156.37, with 154.00 as the deeper technical line
Summary Data HSBC
| Last price | 160.80 HKD |
| Change 1 day / 5 days / 1 month | -1.35% / -0.25% / 2.49% |
| Trend / MA-cross | sideways / none |
| SMA20 / SMA50 | 162.29 / 154.00 |
| RSI (14) / Stochastic %K | 53.0 / 27.0 |
| Bollinger %B / ATR | 37% / 2.93 |
| Support / Resistance 20 days | 156.50 / 168.20 |
| Data as of | 14 Agustus 2026 08:30 WIB |


