OCBC RSI Overbought: Stock Gains 0.92% (Agustus 17, 2026)
On Agustus 17, 2026: price 31.79 SGD, trend uptrend, RSI 77.9, support 28.56, resistance 31.79. technical analysis of ocbc stock. OCBC RSI Overbought — full…

OCBC Bank’s shares on SGX climbed to SGD 31.79, up from SGD 31.50 at the previous close, after extending a run that has already delivered 8.39% over five days and 10.46% over one month. The move keeps the stock pinned near the top of its recent range, and as shown in the chart, it is now trading at the upper Bollinger band rather than the middle of its band structure. That matters because it suggests the market is still rewarding the trend, but it is also paying a premium for that momentum.
Trend & Price Action
The broader setup remains constructive. OCBC is in an uptrend, with the SMA20 at SGD 29.55 sitting well above the SMA50 at SGD 27.00, a classic sign that recent price action has outpaced the longer baseline. The key signal here is not just that price is above both averages, but that the SMA20 slope is rising by 2.82% over five days, which tells readers the short-term trend is still accelerating rather than flattening out.
There is no fresh moving-average crossover, so this is not a new trend ignition story. Instead, it is a continuation phase, where the market has already confirmed the direction and is now testing how far that move can extend. The share price is also sitting at 100% of its 20-day range, with the 20-hour resistance at SGD 31.79 matching the latest print. In plain language, the stock is pressing against the ceiling of its immediate trading band rather than building a cushion underneath it.
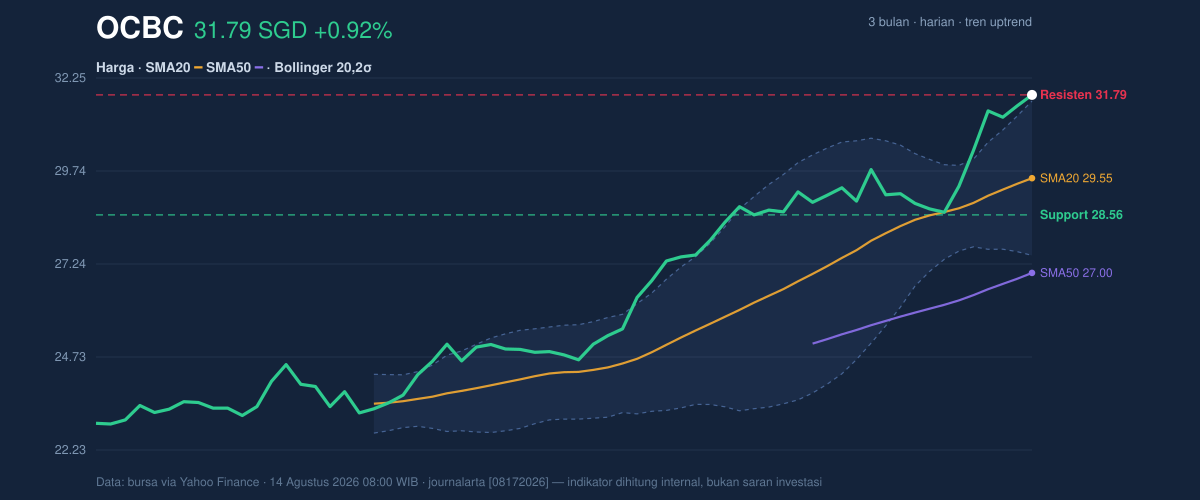
The 3-month high at SGD 31.86 is now the next visible reference point, with the 3-month low at SGD 22.70 showing how much ground has already been covered. That gap helps explain why the market is still willing to chase the name, but it also means the easy part of the move may already be behind it.
Oscillators & Momentum
Momentum indicators are flashing a more cautious message than the trend line. The RSI at 77.9 is in overbought territory, and the Stochastic %K at 97.9 and %D at 94.6 are also overbought. These are not sell signals by themselves, but they do mean the stock is stretched relative to its recent trading history. When both oscillators are this elevated, the market is usually telling us that enthusiasm is strong, yet the risk of pause or consolidation is rising.
That tension is important because the price is still advancing while momentum is already crowded. The MACD at 1.178 remains above the signal line at 1.037, and the histogram at 0.142 is positive, which confirms the trend has not broken down. So the message from the chart is mixed but coherent: the stock is still trending up, while short-term momentum is hot enough to warn that follow-through may become less linear from here.
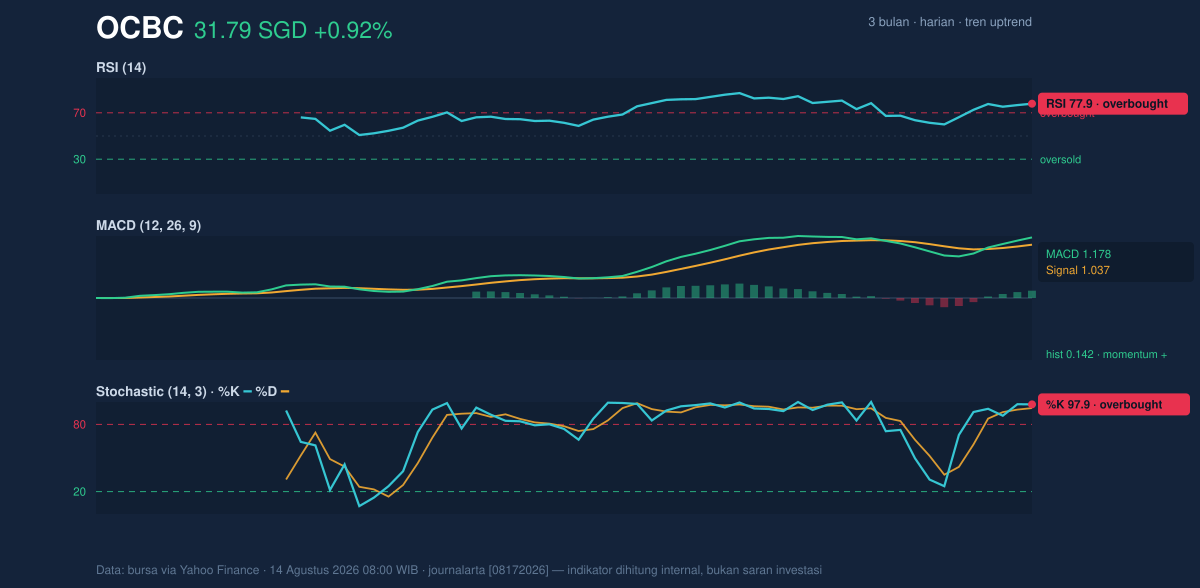
In practice, that combination often leads to narrower advances and sharper intraday swings. It does not imply reversal on its own; it implies the market may need either time or a pullback to reset before the next sustained leg higher can develop.
Volatility & Volume
Volatility is present, but not extreme. The ATR(14) at 0.66, or 2.1% of price, points to moderate volatility, meaning the stock has room to move without being chaotic. The Bollinger band width of 14.1% is described as normal, which suggests this is not a squeeze waiting to explode, nor an overstretched volatility event. The key detail is that price is trading above the upper band at SGD 31.63, with %B at 104%. That is a technical way of saying the stock has pushed beyond the band’s statistical envelope, often a sign of strength, but also a sign that price may be running ahead of its average.
Volume does not yet show a dramatic surge. The latest turnover of 7,230,946 is almost identical to the 20-hour average of 7,232,389, or about 1.0× normal. That means the latest push higher is being supported by steady participation rather than a panic chase. Meanwhile, OBV is rising, which is constructive because it suggests accumulation has been accompanying the move, even if volume has not spiked. In other words, the advance is being accepted, not merely flickered into existence on thin trading.
Key Levels & Scenarios
The immediate technical map is tight. The first support to watch is SGD 28.56, which is the 20-hour support level. Below that, the SMA20 at SGD 29.55 becomes an important reference for trend integrity, because a slip back under the short-term average would signal fading momentum rather than outright breakdown. On the upside, the stock is already pressing against SGD 31.79, with the 3-month high at SGD 31.86 just above it. That makes the next breakout test very narrow: if price clears the high cleanly, it would confirm continuation; if it stalls here, the market may rotate back toward the middle of the band.
The chart therefore points to a stock that is technically strong but increasingly extended. A sustained move above the recent high would keep the trend intact, while failure to hold above the short-term support zone would suggest the current run has become too stretched for immediate continuation.
Technical Verdict: HOLD (wait & see)
Why:
- RSI 77.9 and Stochastic %K 97.9 / %D 94.6 show the stock is overbought, which raises the odds of consolidation.
- MACD 1.178 above signal 1.037 keeps the trend positive, so the chart has not rolled over.
- Price above SMA20 and above the upper Bollinger band at 31.63 signals strength, but also an extended setup.
Verdict invalidated if price falls below SGD 28.56, the nearest listed support.
- Ideal Entry Range: SGD 29.55 to SGD 28.56
- Exit Target: SGD 31.86
- Stop Loss protection: below SGD 28.56
For non-traders, this means the stock still looks strong, but it is stretched enough that patience may matter more than chasing the latest uptick.
Summary Data OCBC
| Last price | 31.79 SGD |
| Change 1 day / 5 days / 1 month | 0.92% / 8.39% / 10.46% |
| Trend / MA-cross | uptrend / none |
| SMA20 / SMA50 | 29.55 / 27.00 |
| RSI (14) / Stochastic %K | 77.9 / 97.9 |
| Bollinger %B / ATR | 104% / 0.66 |
| Support / Resistance 20 days | 28.56 / 31.79 |
| Data as of | 14 Agustus 2026 08:00 WIB |


