Singtel Stock Gains 4.71%, Momentum Weakens In Focus
On Agustus 17, 2026: price 4.45 SGD, trend sideways, RSI 53.4, support 4.25, resistance 4.61. technical analysis of singtel stock. Singtel Stock Gains — full…

Singapore Telecom (Singtel) rose to SGD 4.45 on SGX on 14 August 2026, up from SGD 4.25 the previous close, with the share price now sitting above both its short- and medium-term averages even as the broader trend remains sideways. That combination matters: it says buyers have been willing to pay up in the near term, but not yet strongly enough to overturn the softer underlying slope in the chart. The move also came with heavier participation, as volume jumped to 56,866,700, or 1.6× the 20-day average, which usually means the session was more than a quiet drift and had real market engagement.
Trend & Price Action
The price structure is constructive, but only modestly so. Singtel is trading above SMA20 at SGD 4.41 and SMA50 at SGD 4.39, which tells investors the stock has regained the short-term and intermediate trend lines that traders often use as reference points. Yet the chart still shows a sideways pattern, and the SMA20 slope of -0.53% over 5 days suggests the recent bounce has not fully changed the direction of travel.
That distinction is important. A stock can sit above moving averages and still be range-bound if the averages themselves are flattening or slightly falling. In Singtel’s case, the price is holding in the middle of its recent band rather than breaking into a fresh trend, with the current level at about 56% of the 20-hour range. It is also still below the 3-month high of SGD 5.05 and above the 3-month low of SGD 4.15, which places it in the middle of a broad consolidation rather than at a decisive breakout point.
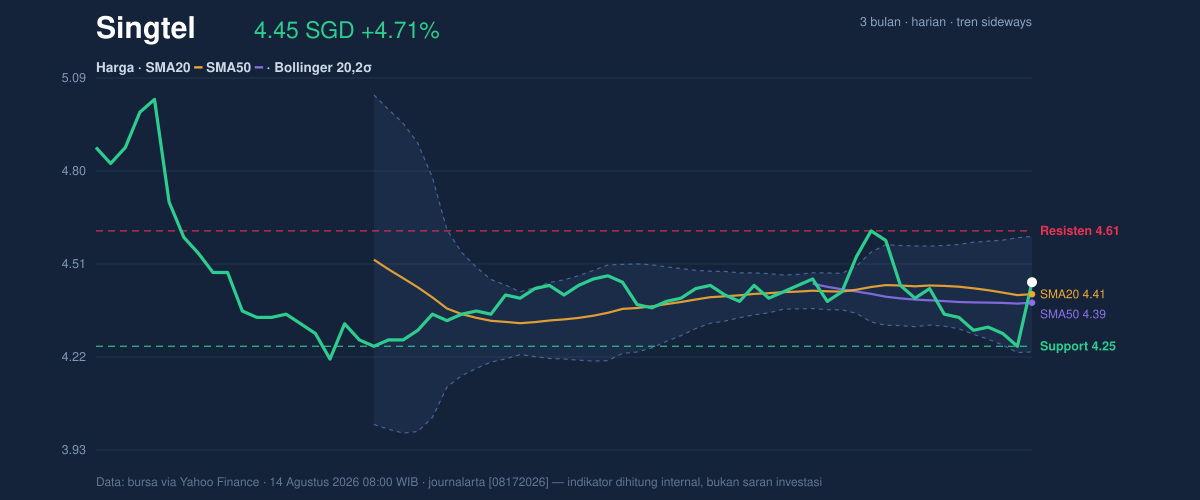
The Bollinger setup reinforces that reading. The bands are relatively contained, with the upper band at SGD 4.59, the middle band at SGD 4.41, and the lower band at SGD 4.23, while the 8.2% band width is described as normal. In plain English, that means the stock is not in a volatility squeeze that usually precedes a sharp move, nor in an expanded, panic-like phase. The price sitting above the middle band but below the upper band suggests the market has improved, though it has not yet pushed into a strong momentum zone.
Oscillators & Momentum
Momentum is less convincing than the price alone might suggest. The RSI at 53.4 is neutral, which means Singtel is neither overbought nor oversold and has room to move either way. The Stochastic %K at 51.0 and %D at 24.5 also sit in neutral territory, but the gap between the two lines is worth watching because it can hint at a short-term turn in pace. A higher %K above %D often signals improving momentum; here, the positioning is not yet strong enough to call that a confirmed shift.
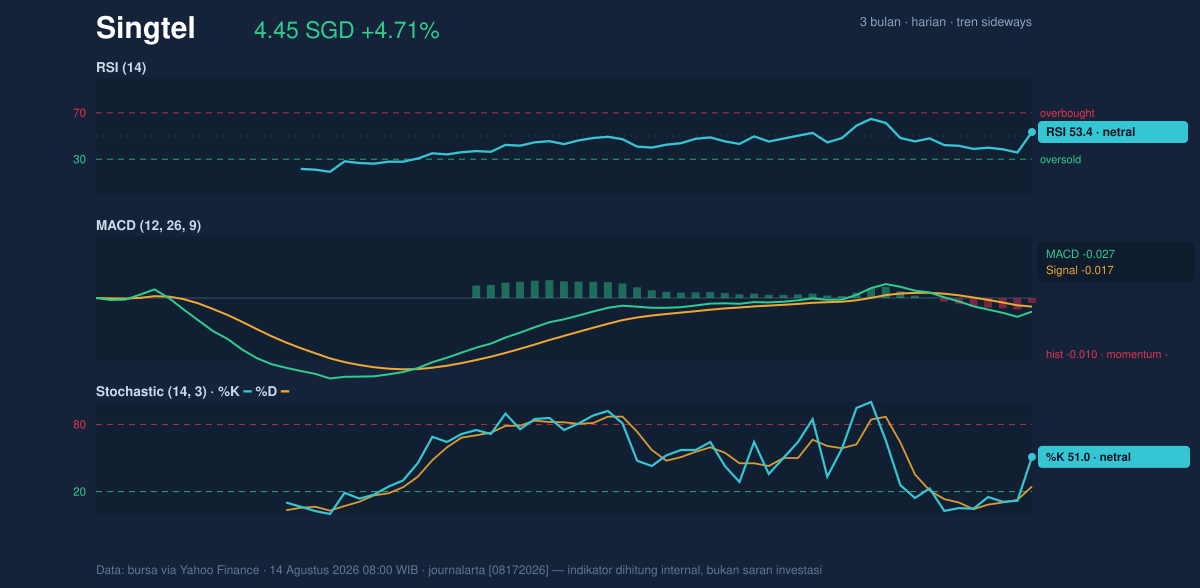
The more cautionary signal comes from MACD. At -0.027, with the signal line at -0.017 and histogram at -0.010, momentum is still negative even though the share price has bounced. That matters because MACD is often used to judge whether a rebound has internal strength. A negative histogram means the faster line is still below the signal line, so the recent rise has not yet converted into a clean bullish momentum turn. In practical terms, the share price is improving faster than the momentum engine underneath it.
Volatility & Volume
The volatility backdrop is moderate. ATR(14) at 0.11, equal to 2.5% of price, suggests normal day-to-day movement rather than a disorderly market. That is useful because it makes nearby technical levels more meaningful; when ATR is moderate, support and resistance tend to be respected more often than in highly volatile names where levels can be sliced through quickly.
Volume, however, adds a more interesting layer. The session’s 1.6× volume surge signals that the move higher was backed by more trading than usual, which generally improves the credibility of the price action. But the OBV is down, and that is the part to watch closely. On-balance volume tracks whether money flow is accumulating or leaving over time; a falling OBV while price firms up can mean the bounce is not yet fully supported by sustained accumulation. In other words, traders showed up for the session, but the longer-term participation trend has not clearly reversed.
Key Levels & Scenarios
The nearest technical floor is SGD 4.25, which is both the 20-hour support and the recent reference point for the latest move. If that level holds, the chart can continue to work through the upper half of the current range. The first meaningful ceiling is SGD 4.61, the 20-hour resistance and the band above the current Bollinger range. A push through that zone would indicate the stock is no longer just recovering inside a range, but attempting to test a higher part of the structure.
The Bollinger middle band at SGD 4.41 also matters because the price is now just above it. That typically acts as a line between neutral and slightly constructive short-term positioning. If the share price slips back below that area, the bounce loses some of its immediate technical edge. The broader range still frames the move: the stock remains well below SGD 5.05 and above SGD 4.15, so the market is still working inside a large corridor rather than escaping it.
Technical Verdict: HOLD (wait & see)
HOLD (wait & see)
- Price is above SMA20 and SMA50, which is constructive, but the sideways trend and SMA20 slope of -0.53% show the broader structure has not fully turned up.
- MACD remains negative, so the rebound has not yet produced confirmed bullish momentum.
- Volume at 1.6× average supports the move, but OBV is down, which tempers confidence that accumulation is broad-based.
Verdict invalidated if price breaks below SGD 4.25.
- Ideal Entry Range: SGD 4.25 to SGD 4.41
- Exit Target: SGD 4.59 to SGD 4.61
- Stop Loss: below SGD 4.23 or, more conservatively, below SGD 4.25
In plain English: the stock is improving, but the chart still needs proof that the bounce can turn into a stronger move rather than just a pause inside a range.
Summary Data Singtel
| Last price | 4.45 SGD |
| Change 1 day / 5 days / 1 month | 4.71% / 2.53% / 1.37% |
| Trend / MA-cross | sideways / none |
| SMA20 / SMA50 | 4.41 / 4.39 |
| RSI (14) / Stochastic %K | 53.4 / 51.0 |
| Bollinger %B / ATR | 60% / 0.11 |
| Support / Resistance 20 days | 4.25 / 4.61 |
| Data as of | 14 Agustus 2026 08:00 WIB |


