Tencent Stock Technicals Today: Drops 0.23%, Testing Support Level
On Agustus 17, 2026: price 440.00 HKD, trend sideways, RSI 40.4, support 434.60, resistance 492.20. technical analysis of tencent stock.

Tencent Holdings slid to HK$440.00 on HKEX on 14 August 2026, down 0.23% from the previous close, as the stock continued to trade below its short- and medium-term averages and near the lower end of its recent range. The move matters less for the size of the drop than for what it says about positioning: sellers still have the upper hand, but the chart is now close enough to support that any further weakness could quickly test whether this decline is simply a pause in a sideways phase or the start of something more damaging.
Trend & Price Action
The broader pattern is still described as sideways, but the slope of SMA20 at -0.41% over 5 days shows that the “flat” label is leaning weaker rather than stable. Tencent is trading below both the SMA20 at HK$464.94 and the SMA50 at HK$455.32, which tells investors that recent price action has failed to reclaim either the short-term or intermediate trend lines. In simple terms, the market is not yet rewarding dip-buying with sustained follow-through. The absence of a fresh MA-cross — no new moving-average crossover — also means there is no technical trigger yet to suggest momentum has decisively turned. As shown in the chart, price is sitting well under the Bollinger midline, which reinforces that the stock remains in the weaker half of its current range.
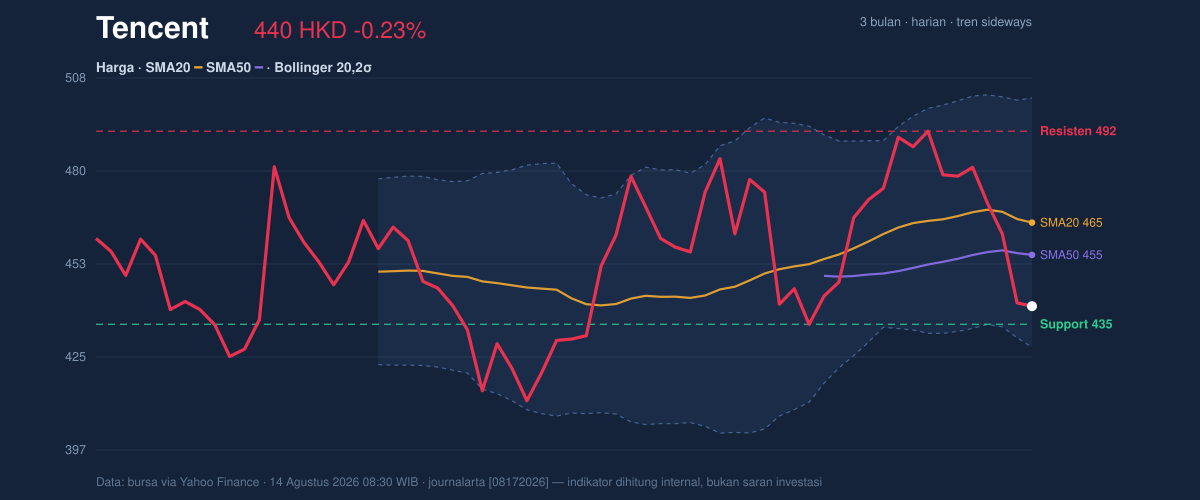
The latest print is also only a few steps above the 20-hour support at HK$434.60, while the 20-hour resistance at HK$492.20 remains a meaningful ceiling. That puts the stock in the lower portion of its banded structure: the price is about 9% into the range, closer to support than resistance. The broader three-month range — HK$497.80 high versus HK$411.00 low — shows that Tencent is not in panic territory, but it is drifting toward the lower half of that corridor. That positioning often signals caution rather than collapse: the market is not breaking down in a straight line, but it is also not showing the conviction needed to reclaim lost ground.
Short version: the chart is soft, not broken.
Oscillators & Momentum
Momentum indicators are mixed, and that mix is the key story. The RSI at 40.4 is still neutral, which means the stock is not yet technically oversold in the classic sense. But the Stochastic %K at 6.5 and %D at 20.1 are both deep in oversold territory, suggesting the recent decline has been fast enough to stretch short-term selling pressure. That can sometimes precede a bounce, but only if price begins to stabilise near support. At the same time, the MACD at 0.559 versus signal 4.872 with a histogram of -4.314 is a clear negative read: the faster trend is still lagging the slower one, and the gap between them says downside momentum has not yet fully faded. As shown in the momentum chart, the oscillators are not aligned in a clean reversal pattern; instead, they show a market that is oversold short term but still under pressure in trend terms.
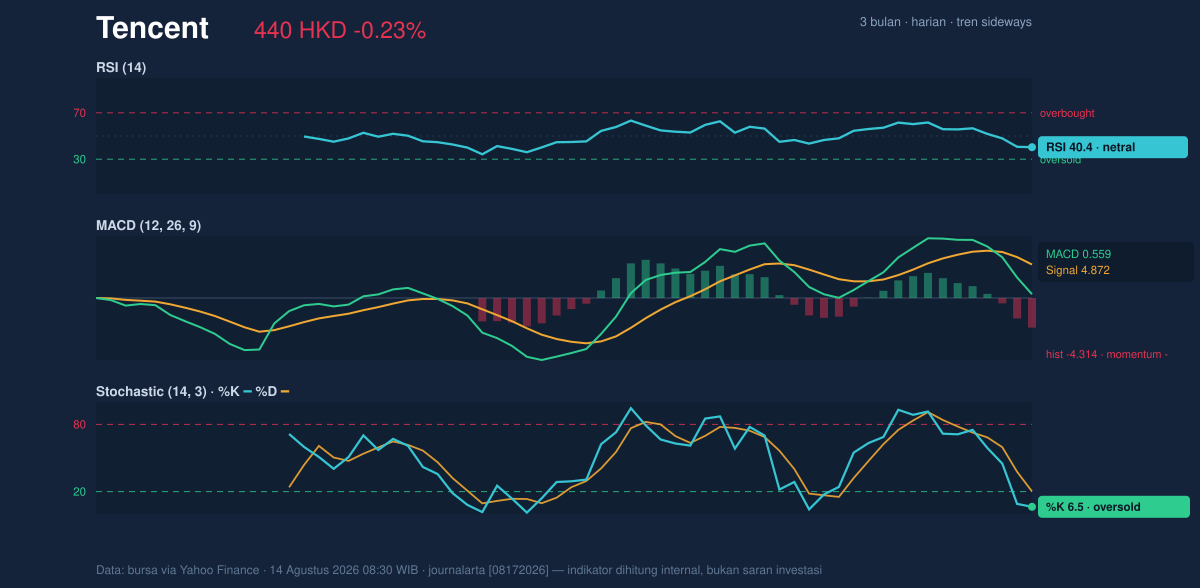
That combination often creates a fragile setup. Oversold Stochastic readings can attract attention, but without MACD improvement and with RSI still only neutral, the signal is more “watch for a base” than “trend reversal confirmed.”
Volatility & Volume
Volatility is present but not extreme. The ATR at 14.00, equal to 3.2% of price, suggests Tencent can still move decisively in either direction over a short horizon, but the Bollinger band width of 16.0% is described as normal rather than compressed or expanded. That matters because a normal-width band does not point to an imminent volatility breakout by itself; it says the stock has room to move, but no squeeze is forcing a dramatic resolution yet. The %B at 16% shows price is sitting near the lower band, which often reflects weak sentiment or a market that has already priced in a good part of the recent selling.
Volume adds a second layer of caution. Last volume of 30,601,060 was only about 1.0× normal versus the 20-hour average of 29,154,370, so the decline has not been accompanied by a dramatic surge in participation. That can mean two different things: either sellers are persistent enough to keep pressure on the stock without needing a capitulation spike, or buyers are not yet committed enough to absorb supply. The fact that OBV is falling leans toward the second interpretation. On-balance volume declining while price is weak usually means money flow is not confirming a recovery attempt.
Key Levels & Scenarios
The immediate technical map is straightforward. HK$434.60 is the first line to watch on the downside. If that level holds, the stock could attempt to stabilise inside the lower part of its range and test whether the oversold Stochastic reading can translate into a rebound. If it fails, the chart would likely shift from “soft sideways” toward a more pronounced bearish phase, especially because price is already below both moving averages.
On the upside, HK$455.32 and HK$464.94 are the first resistance checkpoints, not just because they are round technical references but because they represent the SMA50 and SMA20. Reclaiming those levels would tell the market that the recent slide has been absorbed. Above that, HK$492.20 is the stronger resistance that sits just below the three-month high zone, and it would take a convincing move through that area to change the broader tone.
Technical Verdict: HOLD (wait & see)
The chart does not support a clean bullish reversal yet, but it also does not show a decisive breakdown. The best reading is to wait for confirmation.
- Reason 1: price remains below both the SMA20 at HK$464.94 and SMA50 at HK$455.32, which keeps the trend structure weak.
- Reason 2: the Stochastic is oversold, but the MACD remains negative, so short-term rebound pressure is not backed by stronger trend confirmation.
- Reason 3: %B at 16% and OBV trending down show the stock is near the lower band, yet participation is not clearly turning supportive.
- Invalidation: this verdict is invalidated if price falls below HK$434.60, the 20-hour support.
- Ideal Entry Range: HK$434.60 to HK$455.32
- Exit Target: HK$464.94 to HK$492.20
- Stop Loss protection: below HK$434.60
For non-traders: the stock is weak but not yet broken, and the market is waiting to see whether support at HK$434.60 can hold before making a stronger judgment.
“We need to see whether buyers defend HK$434.60 — if they don’t, the tone changes fast.”
Summary Data Tencent
| Last price | 440.00 HKD |
| Change 1 day / 5 days / 1 month | -0.23% / -8.10% / -4.68% |
| Trend / MA-cross | sideways / none |
| SMA20 / SMA50 | 464.94 / 455.32 |
| RSI (14) / Stochastic %K | 40.4 / 6.5 |
| Bollinger %B / ATR | 16% / 14.00 |
| Support / Resistance 20 days | 434.60 / 492.20 |
| Data as of | 14 Agustus 2026 08:30 WIB |

