UOB Stock Technicals Today: Gains 0.24%, Testing Support Level
On Agustus 17, 2026: price 41.80 SGD, trend sideways, RSI 43.4, support 41.70, resistance 43.89. technical analysis of uob stock. UOB Stock Technicals — full…

United Overseas Bank’s U11.SI shares edged up to 41.80 SGD on SGX, but the move sits inside a broader sideways pattern that still leans softer than it looks at first glance. The stock is only a touch above the prior close of 41.70, yet it remains below its SMA20 at 42.94, which matters because short-term traders often read that as a sign the recent rebound has not yet reclaimed the trend line that usually separates recovery from mere stabilization.
Trend & Price Action
The chart shows a stock that is trying to hold its ground rather than break out decisively. UOB is trading below the SMA20 but above the SMA50 at 41.46, a combination that points to a market caught between short-term weakness and longer-term support. There is no fresh MA-cross, so the moving averages are not giving a clean directional signal; instead, they suggest the recent fade has not yet turned into a full trend reversal.
That nuance matters. The sideways label, together with the -1.18%/5-day slope in SMA20, means the stock has been drifting lower in the near term, but not in a disorderly way. It is also trading near the lower end of its recent range, at just about 5% of the 20-hour range, with 41.70 acting as immediate support and 43.89 as the nearest ceiling. The broader 3-month band, from 37.07 to 45.15, shows there is still room below if support gives way, but also enough overhead resistance to cap quick advances.
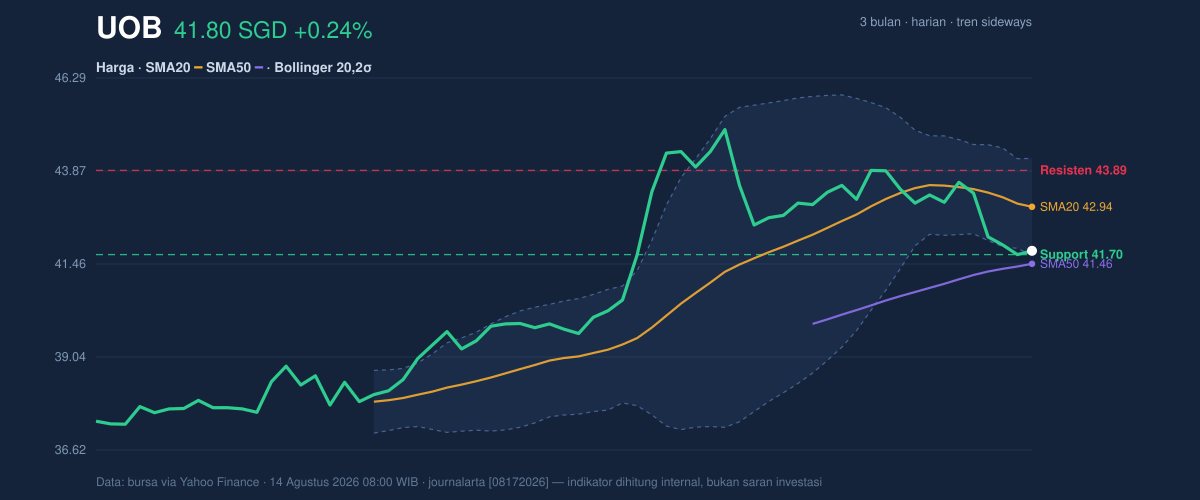
The Bollinger setup sharpens that picture. Price is sitting near the lower band at 41.68, with %B at 5%, which means the stock is hugging the bottom of its recent volatility envelope. When a price sits that close to the lower band while the band width narrows to 5.9%, it often signals compression: the market is coiling, and a larger move can follow. Compression does not tell you direction on its own, but it does tell you that the current calm may not last.
Oscillators & Momentum
The momentum tools are mixed, and that mix is important. RSI at 43.4 is neutral, so the stock is neither stretched nor washed out on a classic momentum basis. That usually means there is no strong overbought or oversold pressure forcing a reversal. But the stochastic oscillator tells a more urgent short-term story: %K at 18.6 and %D at 9.3 sit in oversold territory, suggesting the recent decline has been sharp enough to leave the stock vulnerable to a bounce.
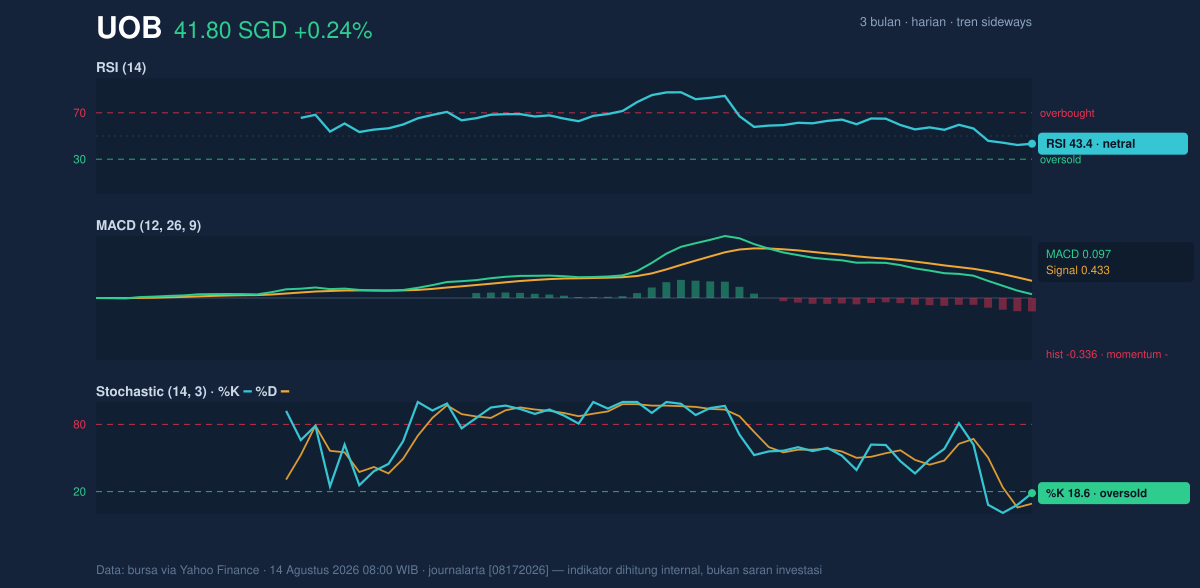
The problem is that the MACD does not confirm that bounce yet. With MACD at 0.097 below the signal line at 0.433, and a -0.336 histogram, momentum remains negative. In plain terms, the trend-following indicator still says downside pressure is stronger than upside conviction. That divergence between oversold stochastic readings and negative MACD often appears when a stock is close to short-term exhaustion, but not yet ready to prove a sustained reversal.
Volatility & Volume
Volatility is present, but not extreme. The ATR at 0.74, equal to 1.8% of price, suggests normal day-to-day movement rather than panic trading. Combined with the Bollinger squeeze, this points to a market that is quiet but potentially preparing for a larger directional move once one side wins control.
Volume is not helping the bulls much. The latest turnover of 3,287,308 is below the 20-day average of 3,886,608, or about 0.8× normal. That means the latest uptick is not being backed by unusually strong participation, which weakens the case for a convincing breakout. The OBV is falling as well, and that matters because on-balance volume tracks whether money flow is accumulating or leaving the stock. A falling OBV while price tries to stabilize usually means buyers have not yet taken control of the tape.
Key Levels & Scenarios
The immediate battle is around 41.70. If that support holds, the stock can continue to base and potentially test the 43.89 resistance zone, where the next layer of selling interest is likely to appear. A move through that level would also put the price closer to the SMA20 at 42.94, which is important because reclaiming that average would improve the short-term structure and reduce the sense of drift.
If 41.70 fails, the chart opens the door toward the lower part of the 3-month range, with 37.07 the key reference for deeper downside risk. The fact that price is already below the SMA20 and that OBV is declining means support is not just a line on the chart; it is the point where the market must prove there is real demand.
The core message is that UOB is compressing inside a narrow range, but the burden of proof still sits with the bulls because momentum has not yet turned positive.
Technical Verdict: HOLD (wait & see)
HOLD (wait & see) fits best because the chart is neither cleanly bullish nor decisively bearish. The stock is below the SMA20 at 42.94, MACD remains negative, and volume is below average, all of which argue against chasing the move. At the same time, Stochastic is oversold and price is sitting just above 41.70 support, so the setup is not broken enough to call outright weakness.
- Ideal entry range: 41.70 to 42.00, where support and the lower Bollinger area converge.
- Exit target: 43.89, with the SMA20 at 42.94 as an earlier checkpoint.
- Stop loss protection: below 41.68, then reassess if the market loses 41.70 support.
- Verdict invalidated if price breaks below 41.70, because that would weaken the current base and reopen the path toward the lower range.
In plain English: the stock looks like it is pausing rather than trending, and the next confirmed move will likely come only after it clears either support or resistance.
Summary Data UOB
| Last price | 41.80 SGD |
| Change 1 day / 5 days / 1 month | 0.24% / -4.08% / -3.91% |
| Trend / MA-cross | sideways / none |
| SMA20 / SMA50 | 42.94 / 41.46 |
| RSI (14) / Stochastic %K | 43.4 / 18.6 |
| Bollinger %B / ATR | 5% / 0.74 |
| Support / Resistance 20 days | 41.70 / 43.89 |
| Data as of | 14 Agustus 2026 08:00 WIB |


