Alibaba Momentum Weakens: Stock Gains 0.25% (Agustus 18, 2026)
On Agustus 18, 2026: price 122.20 HKD, trend uptrend, RSI 52.9, support 110.00, resistance 128.10. technical analysis of alibaba stock.

Alibaba Group’s Hong Kong-listed shares edged up to HKD 122.20 on 14 August 2026, a modest gain that keeps the stock above its short- and medium-term trend lines even as momentum indicators remain mixed, according to Yahoo Finance data for 9988.HK.
The move matters less for its size than for where it happened. Alibaba is still trading above its SMA20 at HKD 119.13 and well above its SMA50 at HKD 111.31, which tells market participants that the broader price structure remains constructive. In plain language, the shares are still climbing within a rising pattern rather than trying to recover from a breakdown. But the pace of that climb has slowed: the stock is up 8.53% over one month, yet down 1.29% over five days, a combination that often signals consolidation after a stronger run rather than a fresh acceleration.
Trend & Price Action
As shown in the chart, Alibaba’s price sits above the middle Bollinger band, which is the 20-day average, and that placement usually indicates the market is still paying a premium to the recent trend. The uptrend is supported by the SMA20 slope of 2.28% over five days, a useful sign because a rising moving average means recent buying has been strong enough to keep lifting the short-term baseline. There is no new MA-cross, so there is no fresh technical event to suggest a sudden change in regime; instead, the chart looks like an established trend that is pausing rather than reversing.
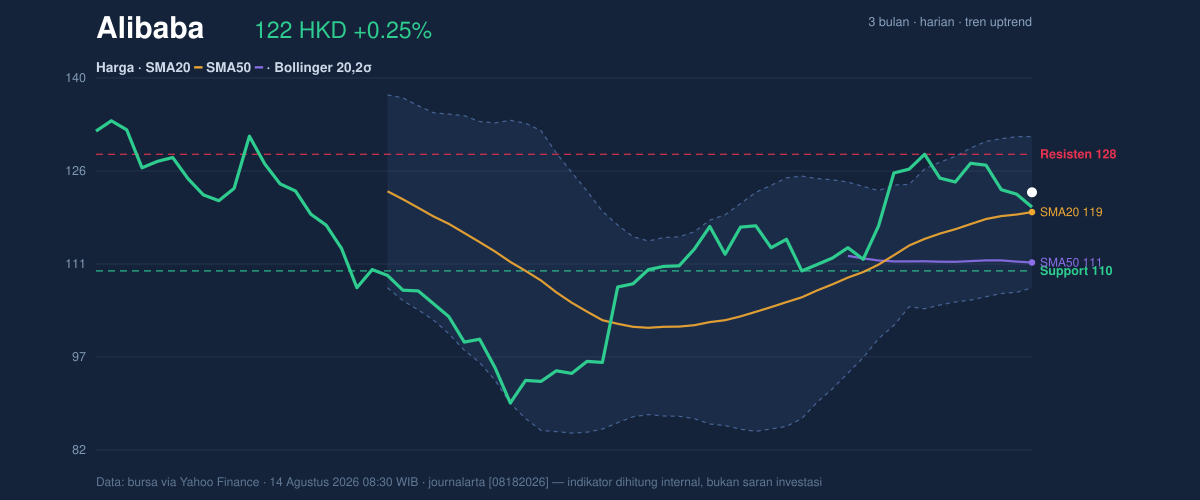
The stock is also trading at 67% of its 20-hour range, which places it closer to resistance than support. That positioning matters because it shows buyers have already pushed the price through a good part of the day’s available range, leaving less room before the next supply zone. The broader three-month range reinforces that context: Alibaba is well above the 3-month low of HKD 88.65 but still below the 3-month high of HKD 135.50, so the shares remain in the upper half of their recent trading corridor without yet testing the top.
A trend can be healthy and still run into overhead supply. This is one of those moments.
Oscillators & Momentum
The momentum picture is more neutral than the price trend. The RSI at 52.9 sits almost exactly in the middle of the scale, which means the stock is neither stretched nor washed out. For non-specialists, RSI is a speed gauge: readings near 50 often imply balance between buyers and sellers, while extreme levels can warn of overheating or exhaustion. Here, there is no such extreme. The Stochastic %K at 48.0 and %D at 58.0 also point to a market that is drifting rather than surging, with no strong overbought or oversold signal.
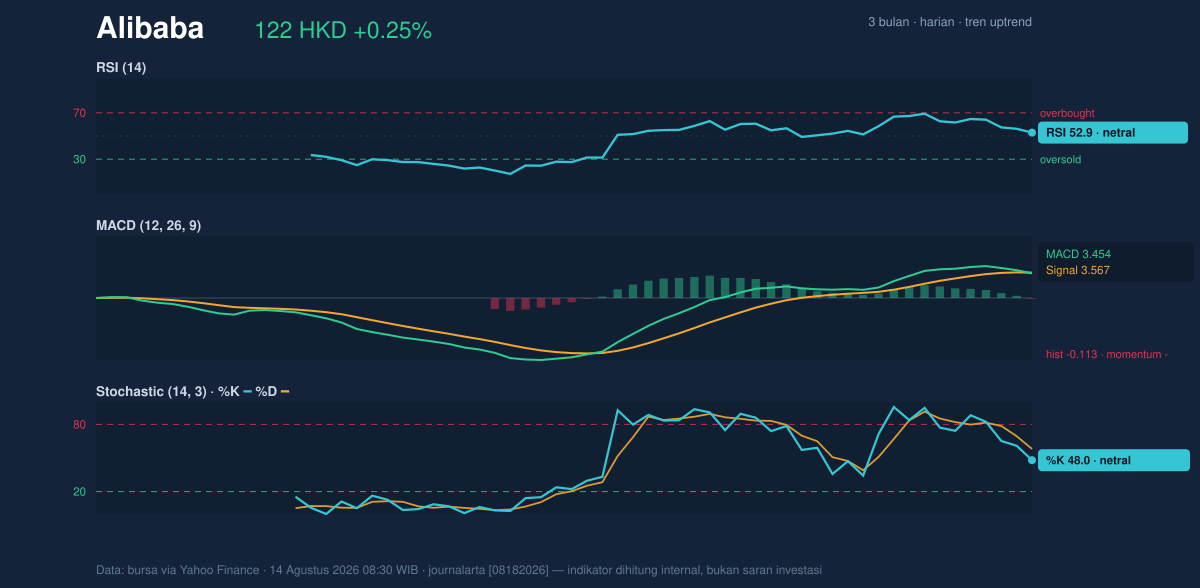
The more important nuance is the MACD. Alibaba’s MACD at 3.454 remains above zero, which is consistent with an uptrend, but it is below the signal line at 3.567 and the histogram is -0.113. That negative histogram means short-term momentum has slipped under its recent average, even though the broader trend has not broken. In other words, the stock is still trending up, but the latest push has lost some force. That often shows up when a rally pauses near resistance or when buyers wait for a clearer catalyst.
Volatility & Volume
Volatility is elevated. The ATR(14) of 4.58, equal to 3.7% of price, suggests the shares can move enough in a single session to matter for short-term positioning. ATR, or average true range, is a measure of typical daily movement; a higher reading means wider swings and a greater chance of price testing nearby support or resistance quickly. At the same time, the Bollinger Bands are not signaling a squeeze: the band width of 19.7% is described as normal, so the market is not tightly compressed ahead of a likely breakout. The %B at 63% shows price is above the midline but still below the upper band at HKD 130.87, leaving room before the chart becomes technically stretched.
Volume tells a more cautious story. Last session’s volume of 56,905,091 was only 0.6x the 20-hour average of 89,752,763, which means the latest move was not backed by unusually strong participation. That matters because price advances on weak volume often lack conviction. Still, OBV is rising, and that is a quiet positive: on-balance volume tracks whether volume is accumulating on up days or distributing on down days. A rising OBV suggests underlying demand has not disappeared, even if the latest session was quieter than normal.
Key Levels & Scenarios
The immediate map is clear. Support at HKD 110.00 is the first major floor, while resistance at HKD 128.10 is the nearest ceiling. The distance between those levels frames the current trade-off: Alibaba is above support, but not yet close enough to resistance to confirm a breakout. If the share price can push through HKD 128.10 with stronger participation, the chart would begin to challenge the upper Bollinger band at HKD 130.87 and then the 3-month high of HKD 135.50. If it fails to hold above HKD 119.13, the middle Bollinger band and SMA20, the trend would look less secure and the market could revisit the HKD 110.00 support zone.
Technical Verdict: HOLD (wait & see)
HOLD (wait & see)
- SMA20 and SMA50 alignment still favors the trend, with price above both averages.
- MACD histogram is negative, showing momentum has softened even while the broader trend remains up.
- Volume ran at 0.6x normal, so the latest rise lacked strong confirmation.
Verdict invalidated if price falls below HKD 110.00.
- Ideal Entry Range: HKD 119.13 to HKD 110.00
- Exit Target: HKD 128.10, then HKD 130.87
- Stop Loss protection: below HKD 110.00
For non-traders: the stock is still trending upward, but the latest push is not strong enough to confirm a fresh breakout.
Summary Data Alibaba
| Last price | 122.20 HKD |
| Change 1 day / 5 days / 1 month | 0.25% / -1.29% / 8.53% |
| Trend / MA-cross | uptrend / none |
| SMA20 / SMA50 | 119.13 / 111.31 |
| RSI (14) / Stochastic %K | 52.9 / 48.0 |
| Bollinger %B / ATR | 63% / 4.58 |
| Support / Resistance 20 days | 110.00 / 128.10 |
| Data as of | 14 Agustus 2026 08:30 WIB |


