CVX Stock Analysis: Gains 2.53%, Testing Key Resistance
On Agustus 18, 2026: price 202.70 USD, trend uptrend, RSI 64.2, support 186.41, resistance 200.00. technical analysis of cvx stock. CVX Stock Analysis — full…

Chevron shares advanced to 202.70 USD on the NYSE, up 2.53% from the previous close of 197.70, and the move pushed the stock just beyond its recent trading band. The gain matters less as a single-day pop than as a test of whether Chevron can hold above a cluster of technical ceilings: the price is now above its SMA20 at 192.66 and SMA50 at 183.99, while also trading above the 20-day resistance at 200.00. In plain terms, the stock has moved into a stronger short-term position, but it is also running into the kind of stretched conditions that often attract profit-taking.
Trend & Price Action
The chart shows Chevron in a clear uptrend, supported by the 1.83% five-day slope in the SMA20, which indicates the short-term average itself is rising rather than flattening out. That is an important signal: when a moving average slopes upward, it usually means recent buying has been persistent enough to lift the baseline. Chevron’s price is now above both major short-term trend markers, with the price sitting above the SMA20 and well above the SMA50, suggesting the stock has regained momentum after a softer stretch earlier in the summer.
At the same time, the stock is no longer cheap on a technical basis. It is trading at 120% of the 20-day range and sits above the 3-month high of 201.63, which means it has already pushed through its recent ceiling and is now in price discovery territory. That can be constructive if buyers continue to absorb supply, but it also means the next move depends heavily on whether the breakout is accepted by the market or quickly faded.
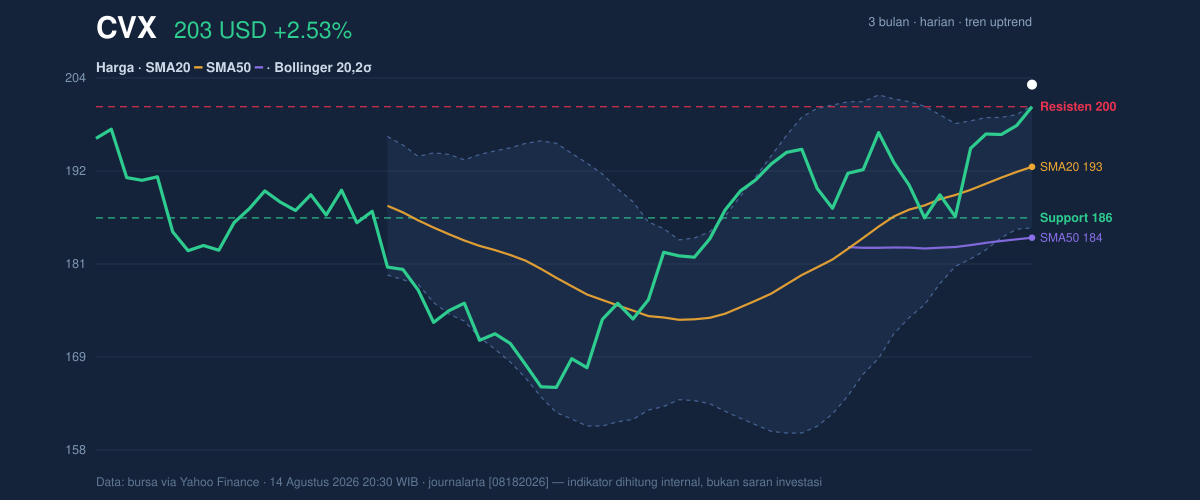
The Bollinger Bands reinforce that tension. Chevron is trading above the upper band at 200.13 with %B at 117%, a reading that shows price has moved beyond the usual statistical envelope. This does not automatically mean reversal; it often means strength. But when a stock closes outside the upper band while the band width is only 7.8%, the message is that the move is happening during a squeeze—a compressed volatility phase that can precede a sharp expansion. In practical terms, the market is signaling that the next swing could be larger than recent day-to-day moves.
The short version: Chevron is strong, but stretched.
Oscillators & Momentum
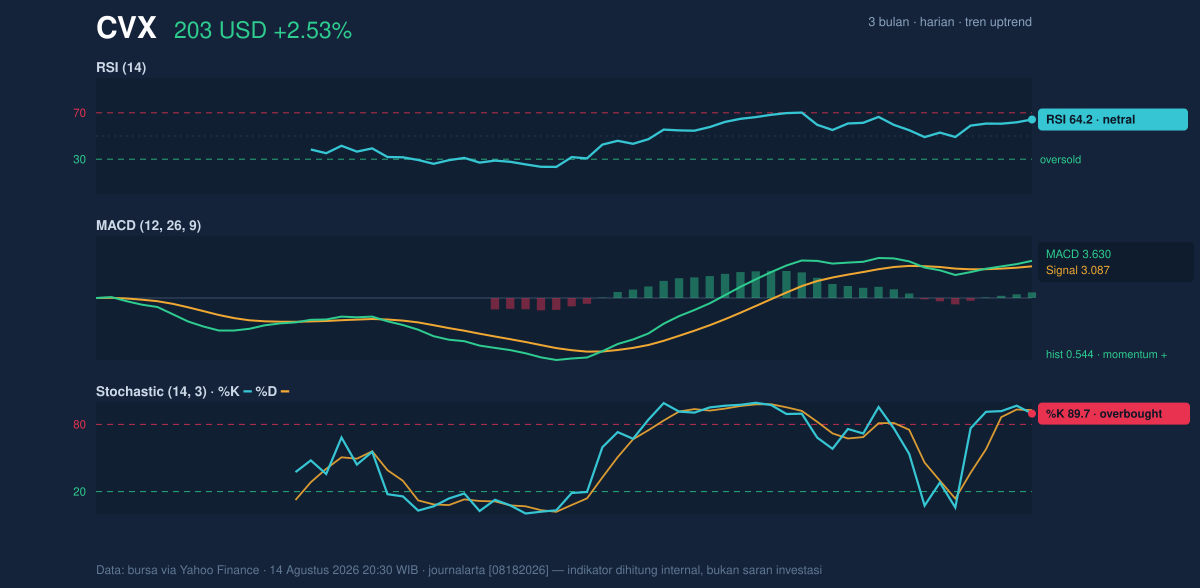
Momentum indicators are more mixed than the price trend. The RSI at 64.2 is still technically neutral, but it is leaning toward the upper end of the range. That suggests buying pressure remains healthy without yet reaching the kind of extreme that would typically warn of an exhausted move. By contrast, the Stochastic %K at 89.7 and %D at 92.8 are both in overbought territory, which usually means the stock has risen fast enough that it may need to pause or consolidate before extending further.
The key nuance is that overbought does not mean weak. It means fast.
That distinction matters because Chevron’s MACD at 3.630 remains above its signal line at 3.087, with a positive histogram of 0.544. MACD is a trend-following momentum gauge, and this configuration says upward momentum is still intact. In other words, the oscillators are not pointing in the same direction: stochastic is warning of near-term fatigue, while MACD says the broader short-term trend still has lift. That kind of split often appears near breakout phases, when price can keep climbing even as fast indicators flash caution.
Volatility & Volume
Volume offers only limited confirmation. The latest turnover of 7,910,500 is essentially in line with the 20-day average of 7,878,835, or about 1.0× normal. That means the move higher was not powered by a dramatic surge in participation. For traders, that is important: a breakout on ordinary volume is not necessarily false, but it is less convincing than one backed by a clear jump in activity.
The OBV is falling, which is the more cautionary signal here. On-Balance Volume tracks whether volume is accumulating on up days or leaking away over time. A declining OBV while price is rising can imply that the latest advance is not being broadly confirmed by participation. Put simply, the tape is up, but the underlying volume trend is not fully cheering it on.
ATR adds another layer. The ATR(14) of 4.82, equal to 2.4% of price, indicates moderate volatility. That means daily swings are not unusually wild, but they are large enough that the stock can still travel meaningfully if the current squeeze resolves into expansion. For now, the setup looks like a stock pressing against resistance with enough volatility to move, but not enough volume evidence yet to call the breakout fully settled.
Key Levels & Scenarios
The immediate map is straightforward. Support at 186.41 is the first level where buyers previously stepped in, and it is also close enough to the SMA20 at 192.66 to matter as a zone rather than a single line. Above, 200.00 is the near-term resistance that has now been challenged, while the 3-month high of 201.63 is the next reference point for whether the move can hold above prior peaks.
If Chevron stays above 200.00 and continues to trade above the upper Bollinger band at 200.13, the market is signaling acceptance of the breakout. If it slips back below those levels, the move starts to look more like an overextended push than a durable trend advance. The most important thing to watch is whether the stock can remain above the breakout area without losing the rising short-term average.
Technical Verdict: HOLD (wait & see)
HOLD (wait & see) because the trend is constructive, but near-term momentum is stretched and volume confirmation is incomplete.
- MACD remains positive, with the line above the signal and a positive histogram, which supports the uptrend.
- RSI at 64.2 is not overbought, but Stochastic at 89.7 / 92.8 shows the move is near-term extended.
- Price above SMA20, SMA50, and the upper Bollinger band suggests strength, but OBV falling and only average volume argue for caution.
Verdict invalidated if price falls below 186.41.
- Ideal Entry Range: 192.66 to 200.13
- Exit Target (Target Price): 201.63
- Stop Loss protection: 186.41
For non-traders: Chevron looks technically strong, but the current move is already stretched, so the market is waiting to see whether the breakout can hold.
Summary Data CVX
| Last price | 202.70 USD |
| Change 1 day / 5 days / 1 month | 2.53% / 8.65% / 8.18% |
| Trend / MA-cross | uptrend / none |
| SMA20 / SMA50 | 192.66 / 183.99 |
| RSI (14) / Stochastic %K | 64.2 / 89.7 |
| Bollinger %B / ATR | 117% / 4.82 |
| Support / Resistance 20 days | 186.41 / 200.00 |
| Data as of | 14 Agustus 2026 20:30 WIB |


