DBS Stock Analysis: Gains 0.50%, Testing Key Resistance
On Agustus 18, 2026: price 76.88 SGD, trend uptrend, RSI 62.3, support 71.90, resistance 76.99. technical analysis of dbs stock. DBS Stock Analysis — full…

DBS Group’s shares closed at 76.88 SGD, up 0.50% on the day and already 6.07% higher over the past month, according to data compiled from SGX via Yahoo Finance as of 14 August 2026, 08:00 WIB. The stock is still in an uptrend, but it is now trading almost at the top of its recent range, with the price sitting at 98% of the 20-day range. That matters: when a large-cap bank is pressing against resistance while momentum indicators are no longer fully aligned, the market is often asking whether this is the start of a clean breakout or just a pause after a strong run.
Trend & Price Action
The broad structure remains constructive. DBS is trading above SMA20 at 74.40 and well above SMA50 at 69.68, which tells investors the medium-term trend is still pointing higher and the stock has not merely bounced—it has been building on a stronger base. The SMA20 slope of 1.53% over 5 days reinforces that the short-term trend is rising rather than flattening out. There is no new MA-cross, so the latest move is being driven by price staying above its moving averages rather than by a fresh technical crossover.
What makes this setup more interesting is the location of the price itself. The stock is now only a fraction below the 20-day resistance at 76.99, while the 3-month high stands at 77.97. In plain English, DBS is testing the ceiling where recent rallies have tended to stall.
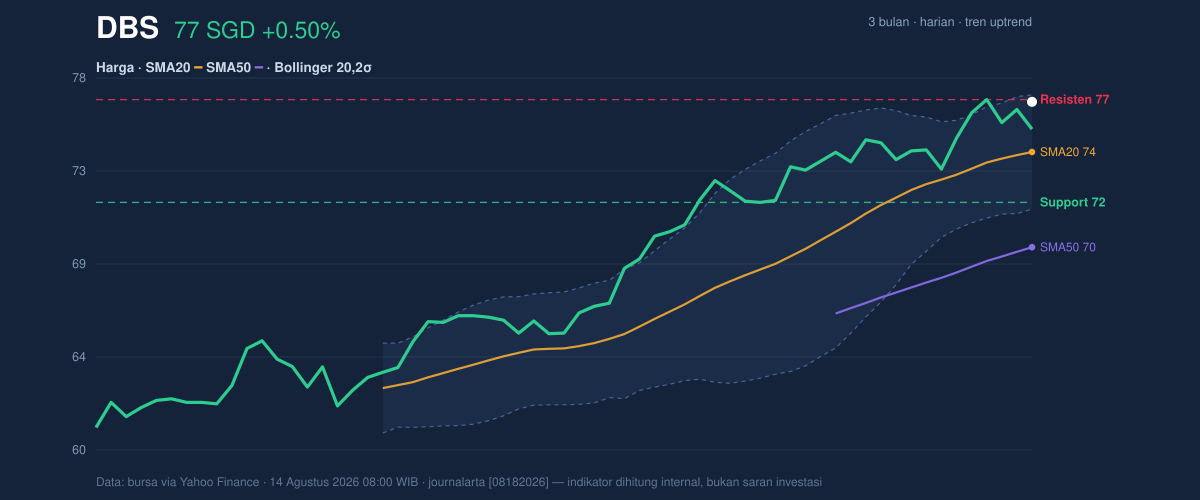
The chart shows a stock that has already done the hard work of recovering trend, but is now running into the market’s memory of prior highs.
Oscillators & Momentum
Momentum is less decisive than the trend. The RSI(14) at 62.3 sits in neutral territory, which is not a warning sign by itself, but it does say the stock is not yet in an overheated condition. The Stochastic %K at 49.1 and %D at 59.9 also read as neutral, suggesting short-term momentum is neither stretched nor deeply washed out. That combination usually points to consolidation rather than a dramatic reversal.
The more cautionary signal comes from MACD. DBS shows MACD at 1.798 versus a signal line at 1.928, leaving a -0.130 histogram. In practical terms, that means the faster trend line has slipped below the slower one, a sign that upside momentum is losing some force even while the broader price trend remains up. This is not a bearish collapse; it is more like the engine downshifting while the car is still moving forward.
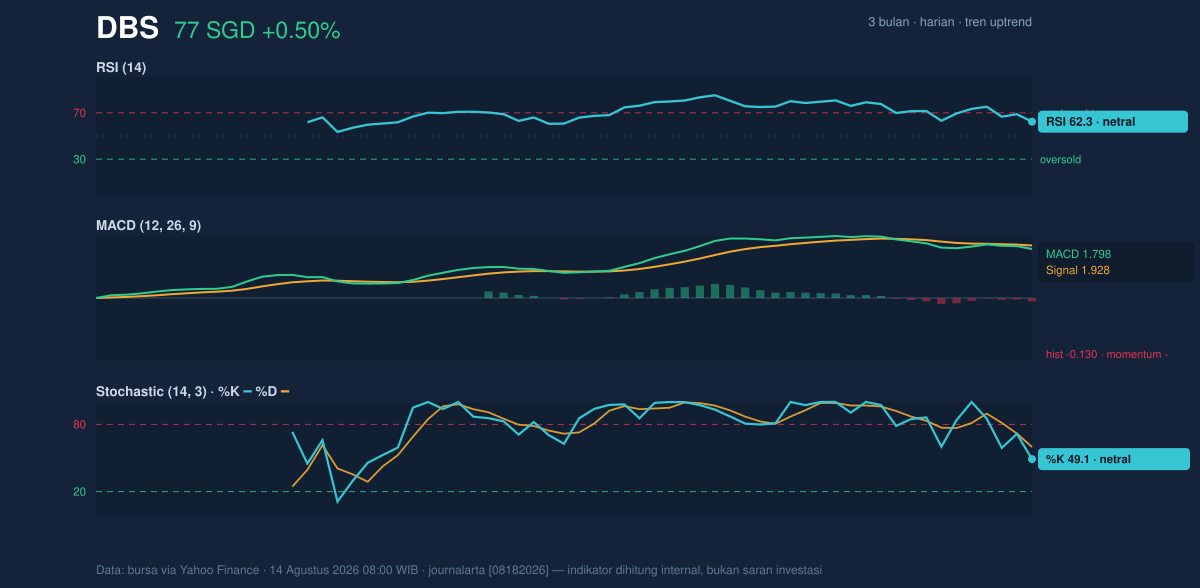
As shown in the chart, momentum is no longer fully synchronized with price, and that divergence is the main reason the stock looks more like a hold-and-watch setup than an outright momentum breakout.
Volatility & Volume
The Bollinger Bands add another layer to the story. DBS is trading near the top band, with the upper band at 77.22, the middle band at 74.40, and the lower band at 71.57. The %B reading of 94% means the price is hugging the upper edge of the band structure, which often happens when a stock is strong but also close to short-term exhaustion points. Importantly, the 7.6% band width is described as a squeeze, which usually signals compressed volatility and the possibility of a sharper move once the range gives way. That can work in either direction.
ATR(14) at 1.28, or 1.7% of price, indicates volatility is moderate rather than wild. So while a breakout is possible, the market is not currently pricing in a disorderly swing.
Volume is doing its part. Last traded volume of 5,077,557 shares is just above the 20-session average of 4,985,030, or about 1.0x normal. That is enough to say participation is real, but not enough to claim strong conviction. The encouraging detail is that OBV is rising, which means volume has been more supportive of price advances than declines. In technical terms, that is a quiet endorsement from the market’s underlying flow.
Key Levels & Scenarios
The immediate battleground is tight. DBS has support at 71.90 and resistance at 76.99, with the 20-day Bollinger upper band at 77.22 sitting just above that resistance. That clustering matters because it creates a narrow zone where either a breakout or a rejection could become visible quickly.
If the stock can push through 76.99 and then clear 77.22, the next reference point is the 3-month high of 77.97. A move through that area would signal that the squeeze is resolving upward rather than fading.
If price fails to hold 74.40, the middle Bollinger band, the tone would soften materially because that level also marks the short-term trend line. A deeper break toward 71.90 would show that the recent advance has lost its grip on support.
Technical Verdict: HOLD (wait & see)
HOLD (wait & see)
- Trend remains positive: price is above SMA20 at 74.40 and SMA50 at 69.68, with the SMA20 still rising.
- Momentum is mixed: RSI 62.3 and Stochastic 49.1/59.9 are neutral, while MACD is below signal with a -0.130 histogram.
- Price is stretched near resistance: the stock sits near 76.99, close to the 77.22 Bollinger upper band and the 77.97 three-month high, which raises the odds of a pause before any further advance.
- Verdict invalidated if price breaks below 71.90, because that would damage the recent range structure and weaken the current uptrend.
- Ideal Entry Range: 74.40 to 71.90
- Exit Target: 76.99 to 77.97
- Stop Loss protection: below 71.90
In plain English: DBS is still trending higher, but it is close enough to resistance that the market is likely waiting for proof before the next move.
“The squeeze is there — now the market has to decide whether it breaks up or gives back some of the recent climb.”
Summary Data DBS
| Last price | 76.88 SGD |
| Change 1 day / 5 days / 1 month | 0.50% / 2.40% / 6.07% |
| Trend / MA-cross | uptrend / none |
| SMA20 / SMA50 | 74.40 / 69.68 |
| RSI (14) / Stochastic %K | 62.3 / 49.1 |
| Bollinger %B / ATR | 94% / 1.28 |
| Support / Resistance 20 days | 71.90 / 76.99 |
| Data as of | 14 Agustus 2026 08:00 WIB |


