HSBC Stock Gains 0.31%, Momentum Weakens In Focus
On Agustus 18, 2026: price 163.50 HKD, trend uptrend, RSI 53.2, support 156.50, resistance 168.20. technical analysis of hsbc stock. HSBC Stock Gains — full…

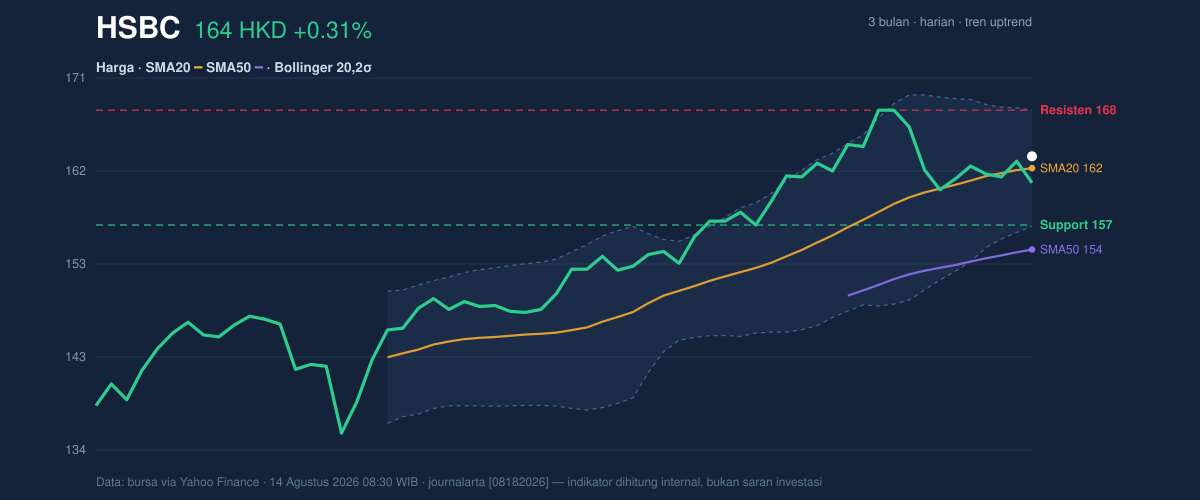
HSBC Holdings’ Hong Kong-listed shares ended at HKD 163.50, up 0.31% on the day and 4.21% over one month, with price still holding above the short-term trend line. The signal is not one of runaway strength, though: the stock sits above SMA20 at HKD 162.29 and well above SMA50 at HKD 154.00, but momentum gauges are no longer fully in sync. As shown in the chart, the broader structure remains constructive, yet the latest move looks more like a consolidation inside an uptrend than a fresh acceleration.
Trend & Price Action
The price structure is still tilted upward. The stock is trading above both major moving averages, and the SMA20 is rising 1.06% over five days, which matters because a rising short-term average usually means recent demand is still strong enough to keep pullbacks contained. But there is an important nuance: there is no new MA-cross, so this is not a fresh moving-average breakout story. It is an established uptrend that is pausing rather than re-rating sharply.
The position in the range is also telling. HSBC is sitting at about 60% of the 20-day range, between support at HKD 156.50 and resistance at HKD 168.20. That places the stock closer to the upper half of its recent band, but still below the ceiling. The 3-month high of HKD 169.70 is only slightly above that resistance, which means the market has already approached the area where sellers previously emerged.
What this means in plain terms: the trend is healthy, but the next leg needs confirmation, not just drift.
Oscillators & Momentum
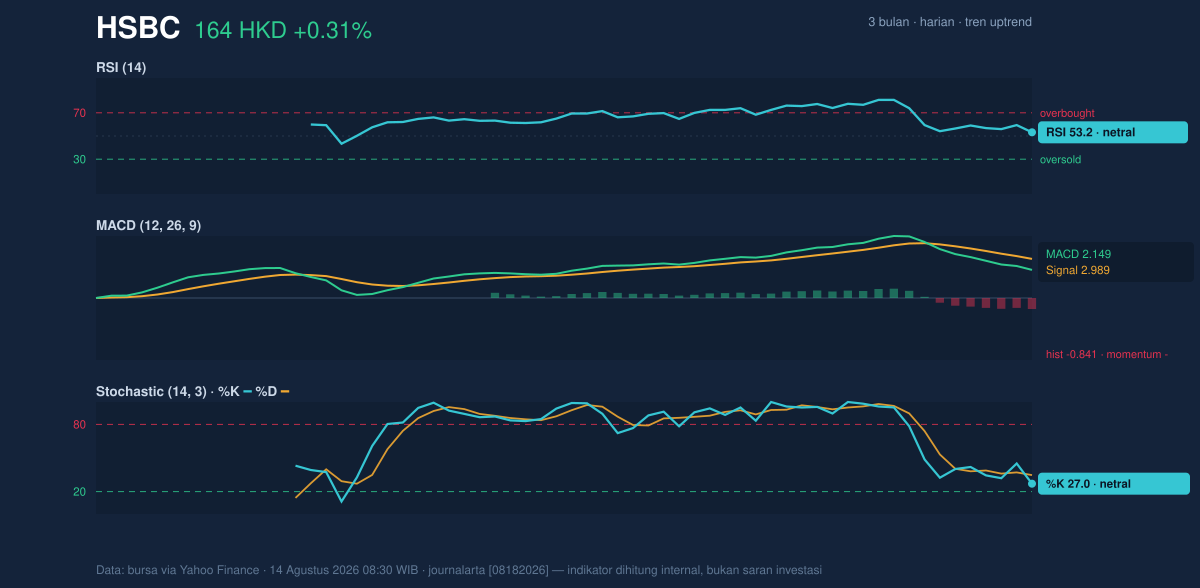
The momentum picture is more cautious than the price chart. RSI at 53.2 is neutral, which usually signals balance rather than excess enthusiasm. That is not a bearish reading by itself; it simply says the shares are neither stretched nor deeply oversold. The Stochastic %K at 27.0 and %D at 34.7 also sit in neutral territory, but they lean toward the lower end of the range, suggesting short-term momentum has cooled.
The more important warning comes from MACD. MACD at 2.149 is below its signal line of 2.989, and the histogram at -0.841 shows negative momentum. In practical terms, that means the price can still rise while internal momentum weakens — a common setup when a stock is climbing, but at a slower pace and with less conviction from buyers. This is why the chart can look firm even while the oscillator panel looks less supportive.
So the message from momentum is simple: the trend is intact, but the engine is not revving hard.
Volatility & Volume
Volatility is moderate, not elevated. ATR(14) at 2.93, or 1.8% of price, suggests the stock typically moves in measured steps rather than sharp swings. That matters because it frames the likely size of near-term moves around the current level. The Bollinger Bands add a second layer: the upper band is HKD 168.21, the middle band is HKD 162.29, and the lower band is HKD 156.37. Price is above the middle band and not far from the upper band, while the %B reading of 60% shows it is above the midpoint of the band structure, but not yet pressing the top.
The key detail is band compression. The 7.3% Bollinger width is described as narrowing, which often signals a squeeze — a period where price action tightens before a larger move. That does not predict direction, but it does mean the stock may be storing energy. In such setups, the breakout usually needs volume to validate it.
At the moment, volume is not cooperating. Last volume was 6,724,838, only 0.5x the 20-day average of 14,143,220. That is light participation, and the OBV is falling, which matters because OBV tracks whether volume is flowing into the stock or away from it. A rising price with falling OBV often suggests the move is not broad-based. It can continue, but it is less persuasive.
The market is moving, but not loudly.
Key Levels & Scenarios
The immediate map is clear from the chart. HKD 156.50 is the first support to watch, close to the lower Bollinger band at HKD 156.37. That cluster matters because if price loses that zone, the technical tone would weaken quickly: it would mean the stock has slipped back through both near-term support and the lower edge of its recent volatility envelope. On the upside, HKD 168.20 is the first resistance, almost identical to the Bollinger upper band at HKD 168.21. A clean move through that area would suggest the squeeze is resolving upward.
The broader range still anchors the story. The 3-month high at HKD 169.70 is the next reference if resistance gives way, while the 3-month low at HKD 133.50 remains a distant floor and a reminder that HSBC has already recovered a substantial amount of ground. Because the stock is trading above the middle band and above SMA20, the near-term bias remains constructive — but the weak volume and negative MACD say the market has not yet proven that it can extend the move with conviction.
Technical Verdict: HOLD (wait & see)
HOLD (wait & see) fits best because the price trend is still positive, but momentum and participation are mixed.
- Reason 1: Price remains above SMA20 at HKD 162.29 and SMA50 at HKD 154.00, which keeps the broader trend intact.
- Reason 2: MACD is negative versus its signal line, showing the move lacks strong internal momentum.
- Reason 3: Volume is only 0.5x the 20-day average and OBV is falling, so the recent rise is not yet backed by strong participation.
- Invalidation: this verdict is invalidated if price falls below HKD 156.50, which would break support and the lower Bollinger band area.
- Ideal Entry Range: HKD 156.50 to HKD 162.29
- Exit Target: HKD 168.20 to HKD 169.70
- Stop Loss Protection: below HKD 156.37
In plain English: HSBC’s Hong Kong shares are still in an uptrend, but the market is waiting for stronger proof before the next move.
Summary Data HSBC
| Last price | 163.50 HKD |
| Change 1 day / 5 days / 1 month | 0.31% / 1.43% / 4.21% |
| Trend / MA-cross | uptrend / none |
| SMA20 / SMA50 | 162.29 / 154.00 |
| RSI (14) / Stochastic %K | 53.2 / 27.0 |
| Bollinger %B / ATR | 60% / 2.93 |
| Support / Resistance 20 days | 156.50 / 168.20 |
| Data as of | 14 Agustus 2026 08:30 WIB |


