Momentum Weakens, AIA Stock Gains 1.17% Today
On Agustus 18, 2026: price 73.40 HKD, trend sideways, RSI 31.0, support 70.40, resistance 79.65. technical analysis of aia stock. Momentum Weakens — full…

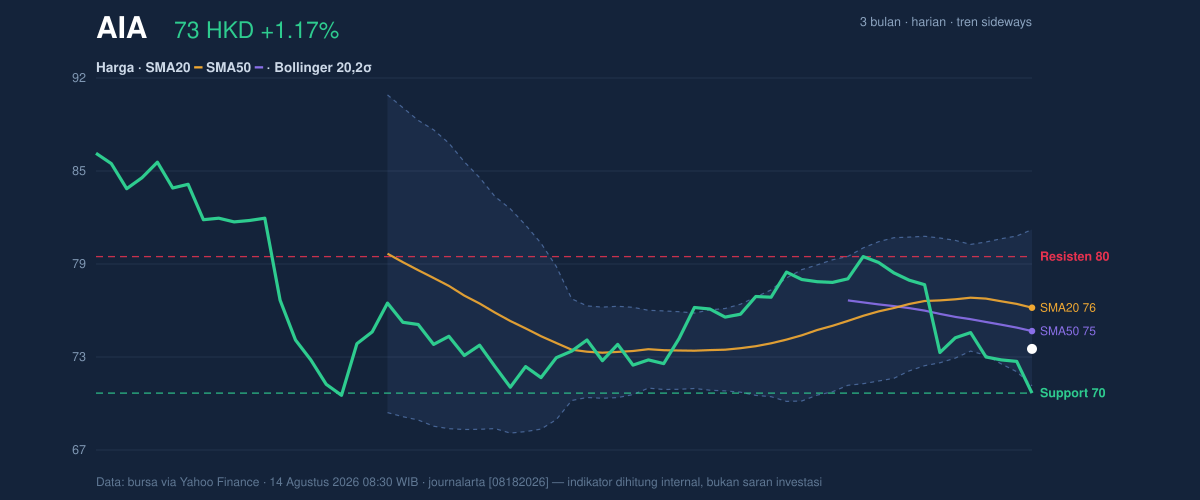
AIA Group’s Hong Kong-listed shares finished at 73.40 HKD, up 1.17% on the day, but the move sits inside a broader soft patch: the stock is still down 1.01% over 5 days and 2.85% over 1 month, according to data from the exchange via Yahoo Finance. That combination matters because it suggests a bounce, not yet a trend change. The price is still trading below the SMA20 at 76.19 and below the SMA50 at 74.61, which keeps the chart in a cautious posture even after the latest uptick.
Trend & Price Action
The stock remains in a sideways trend, with the SMA20 sloping down by -0.74% over 5 days. That downward tilt is a small but important signal: it shows short-term averages are still easing lower, so rallies have not yet been strong enough to reverse the recent drift. There is also no fresh MA-cross, meaning the moving averages have not produced a new crossover to confirm a stronger directional move.
As shown in the chart, the price is sitting at about 32% of the 20-day range, closer to support than resistance. That positioning usually implies the market is still testing whether buyers can defend the lower end of the range rather than driving into a breakout. The 3-month high at 87.40 and 3-month low at 69.05 frame the broader battleground. With the share price above the 3-month low but still well under the recent moving averages, the chart looks more like consolidation under pressure than a clean recovery.
Oscillators & Momentum
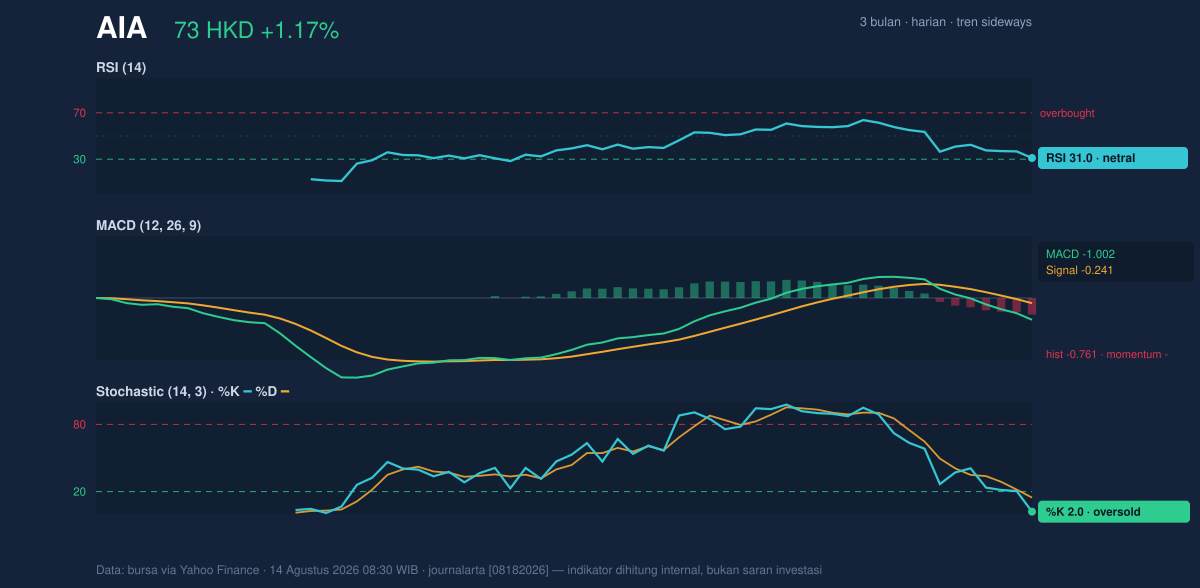
The momentum picture is mixed, and that mix is the key signal. The RSI at 31.0 is near the lower edge of neutral territory, which tells readers the stock is not deeply oversold by that measure, but it is close enough to the lower band that downside momentum may be tiring. By contrast, the Stochastic %K at 2.0 and %D at 14.6 are clearly oversold. In plain language, the latest price action has pushed the stock toward the lower end of its recent trading rhythm, and that often precedes either a bounce or a pause.
The more important caution comes from the MACD at -1.002, below its signal line at -0.241, with a histogram of -0.761. That setup indicates negative momentum is still dominant. Even if the stock is stretched on short-term oscillators, the MACD says the underlying push has not yet flipped back to positive. This is why the recent rise should be treated as a test of strength rather than proof of a new uptrend.
Volatility & Volume
Volatility is present, but not extreme. The ATR(14) at 2.10, equal to 2.9% of price, points to moderate day-to-day movement. That matters because it means the stock can still travel meaningfully within a session, but not in the kind of explosive way that usually accompanies a major trend break. The Bollinger Bands help sharpen that view. Price is near the lower half of the band structure, with %B at 24%, while the band width of 13.9% is described as normal. In practical terms, the stock is trading relatively close to the lower band, but the bands are not squeezing tightly enough to signal an imminent volatility breakout on their own.
Volume adds a more encouraging note, though it is not decisive. The latest turnover of 39,252,330 was about 1.4× the 20-day average of 27,921,851. Higher volume on a modest rebound can mean buyers are willing to engage near lower levels. But the OBV is falling, and that is the more telling signal. OBV, or on-balance volume, tracks whether volume is accumulating on up days or down days. A falling OBV says participation has not yet shifted into sustained accumulation, so the latest volume spike looks more like interest in a rebound than broad confirmation of a trend reversal.
Key Levels & Scenarios
The chart’s immediate map is clear. Support at 70.40 is the first line that matters, with the 3-month low at 69.05 just below it as the next reference point. On the upside, resistance at 79.65 is the level that would need to be reclaimed before the stock could start repairing its technical damage. The SMA50 at 74.61 sits just above the last price and acts as a near-term pivot. If the stock can close back above that average and hold, it would show the recent bounce is doing more than merely reacting to oversold readings. If it fails to hold 70.40, the market would likely be forced to retest the 69.05 low area, where the broader range begins to matter again.
The most useful way to read the setup is this: oversold stochastics and a low %B hint at rebound potential, but the negative MACD, falling OBV, and price still below both moving averages say the burden of proof remains with buyers. The stock is not in free fall, yet it has not regained technical control.
Technical Verdict: HOLD (wait & see)
HOLD (wait & see)
- MACD remains negative, showing downside momentum is still in place.
- Price is below SMA20 and SMA50, so the trend structure has not turned constructive.
- Stochastic is oversold and %B is low, which supports rebound potential, but not enough confirmation for a stronger directional call.
Verdict invalidated if price falls below 70.40, because that would put the 69.05 3-month low back in play.
- Ideal Entry Range: 70.40 to 74.61
- Exit Target: 79.65
- Stop Loss: below 69.05
For non-traders, this means the chart is weak but not broken, and the next move still needs proof from price, not just a bounce in momentum.
Summary Data AIA
| Last price | 73.40 HKD |
| Change 1 day / 5 days / 1 month | 1.17% / -1.01% / -2.85% |
| Trend / MA-cross | sideways / none |
| SMA20 / SMA50 | 76.19 / 74.61 |
| RSI (14) / Stochastic %K | 31.0 / 2.0 |
| Bollinger %B / ATR | 24% / 2.10 |
| Support / Resistance 20 days | 70.40 / 79.65 |
| Data as of | 14 Agustus 2026 08:30 WIB |


