Momentum Weakens, Shell Stock Gains 1.26% Today
On Agustus 18, 2026: price 3,329.50 GBp, trend uptrend, RSI 55.9, support 3,220.00, resistance 3,405.50. technical analysis of shell stock.

Shell plc edged higher on the LSE in London on 14 August 2026, with Shell at 3,329.50 GBp, up from 3,288.00 and extending a short-term advance that has now carried the shares 1.26% higher on the day, 1.59% over five days and 2.89% over one month. The move matters because it is happening above the near-term trend line, but not with the kind of momentum that usually signals a clean breakout; the stock is advancing, yet the internal signals are mixed, which often means traders are still testing whether the latest strength is durable or just another pause inside a broader range.
Trend & Price Action
Shell remains in an uptrend, and that is visible in the relationship between price and its short- and medium-term averages. The shares are trading above the SMA20 at 3,306.88 and well above the SMA50 at 3,151.62, which tells the market is still paying up for the stock in both the tactical and intermediate time frames. The SMA20 is rising at 1.23% over five days, a useful signal because a climbing average usually means recent buying has been persistent enough to lift the trend line itself, not just the last print.
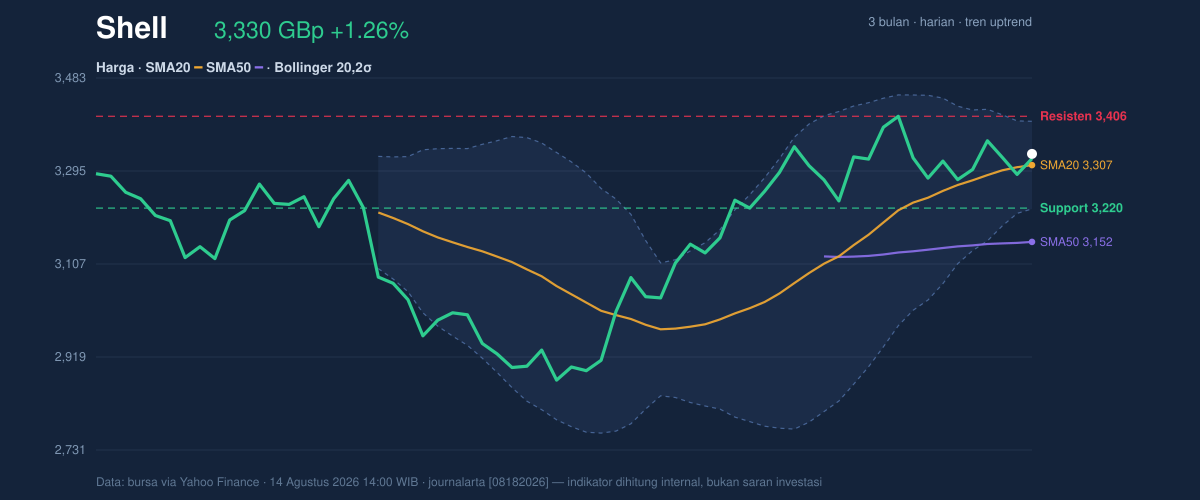
The chart also shows the price sitting at 59% of its 20-hour range, which is a neutral-to-firm position rather than an extended one. That placement matters: Shell is not pressing against the top of the range, so there is still room for continuation if demand improves, but it is also not deep enough into support to suggest a bargain-hunting setup. The 20-hour support at 3,220.00 is the first line that buyers will want to protect, while 3,405.50 marks the immediate ceiling. A clean move through that resistance would signal that the current drift higher has turned into a more decisive advance; failure there would suggest the stock is still trapped inside its recent band.
The broader range remains wide enough to keep context in view. Over three months, Shell has traded between 3,758.50 and 2,559.50, so today’s level sits comfortably above the lower half of that span but still well below the upper end. In plain terms, the stock has recovered meaningfully from its weaker phase, yet it has not reclaimed the kind of territory that would imply a full trend reset.
Oscillators & Momentum
Momentum is less convincing than the price action. The RSI at 55.9 is neutral, which usually means the shares are neither stretched nor washed out; that is consistent with a market that is advancing, but not with enough force to look overheated. The Stochastic %K at 45.8 and %D at 41.0 are also neutral, reinforcing the idea that Shell is moving without an obvious momentum extreme. That can be constructive in an uptrend because it leaves room for further gains, but it also means the market has not yet generated the kind of oscillator thrust that often accompanies a breakout.
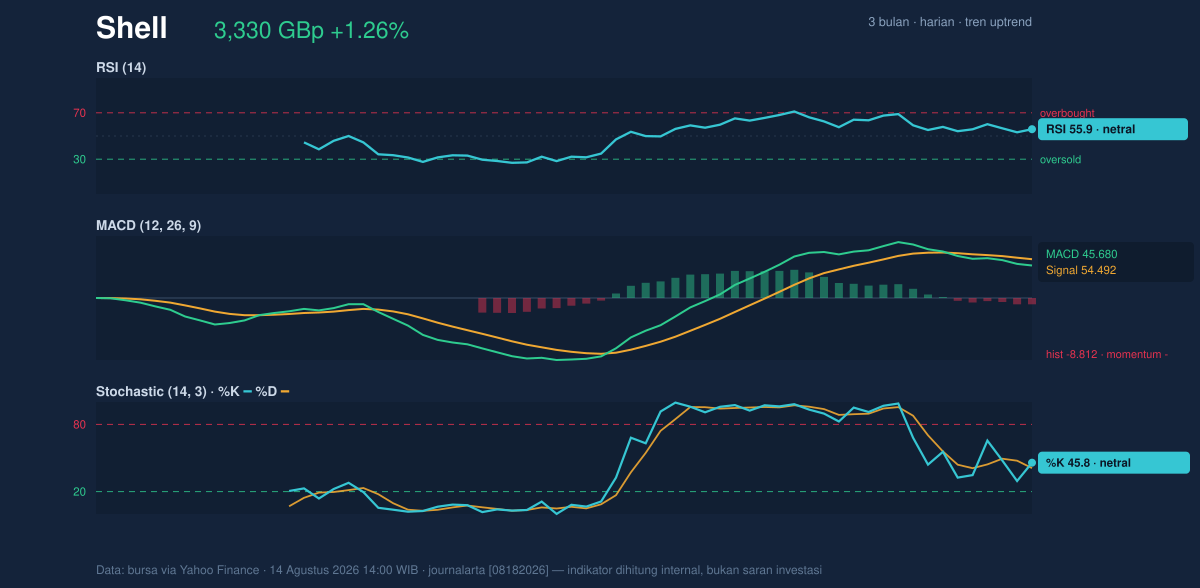
The more important caution comes from the MACD at 45.680 versus its signal line at 54.492, with a histogram of -8.812. MACD is a trend-following momentum tool, and when the main line sits below the signal line with a negative histogram, it usually means upside momentum is fading even if price has not turned down yet. In other words, Shell is still in an uptrend, but the engine is not firing as strongly as the price alone might suggest. That divergence is worth watching because it often appears before either a consolidation or a sharper directional move.
Volatility & Volume
Volatility is moderate rather than explosive. The ATR(14) at 71.45, equal to 2.1% of price, implies that daily swings are still large enough to matter, but not so large that the stock is behaving erratically. The Bollinger structure adds another clue: the upper band is 3,395.42, the middle band is 3,306.88, and the lower band is 3,218.33. Price at %B 63% sits slightly above the midpoint, which is consistent with a constructive bias but not an overbought one.
The more notable feature is that the bands are 5.4% wide and narrowing. A squeeze usually means the market has been coiling, and coiling markets often resolve with a larger move than the recent day-to-day drift. That does not tell us direction on its own, but it does tell us that the current calm may not last. If Shell can push through the upper band and the nearby resistance together, the squeeze would support continuation; if it loses the middle band and support, the same setup can accelerate downside. Volume leans supportive for now: the latest print of 11,446,789 is about 1.3× the 20-hour average of 8,648,591, which suggests the move has real participation. Yet OBV is falling, and that is the subtle warning sign — on-balance volume tracks whether volume is accumulating on up days or leaking away over time, so a declining line implies the recent rise has not fully won the longer-running volume battle.
Technical Verdict: HOLD (wait & see)
HOLD (wait & see)
- Reason 1: Price is above the SMA20 at 3,306.88 and SMA50 at 3,151.62, which keeps the trend constructive.
- Reason 2: RSI 55.9 and Stochastic %K 45.8 / %D 41.0 are neutral, so there is room for continuation without obvious overheating.
- Reason 3: MACD 45.680 below signal 54.492 with a -8.812 histogram, plus OBV down, says momentum and volume confirmation are not yet fully aligned with the price rise.
- Verdict invalidated if price breaks below 3,220.00, because that would put the shares back through the nearest support and weaken the current trend structure.
- Ideal Entry Range: 3,306.88 to 3,220.00
- Exit Target (Target Price): 3,395.42 to 3,405.50
- Stop Loss protection: below 3,218.33, with 3,220.00 as the practical support trigger
For non-traders, this means Shell is still climbing, but the market has not yet shown enough confirmation to call the move fully settled.
“What happens next at 3,405.50 will tell the real story.”
Summary Data Shell
| Last price | 3,329.50 GBp |
| Change 1 day / 5 days / 1 month | 1.26% / 1.59% / 2.89% |
| Trend / MA-cross | uptrend / none |
| SMA20 / SMA50 | 3,306.88 / 3,151.62 |
| RSI (14) / Stochastic %K | 55.9 / 45.8 |
| Bollinger %B / ATR | 63% / 71.45 |
| Support / Resistance 20 days | 3,220.00 / 3,405.50 |
| Data as of | 14 Agustus 2026 14:00 WIB |

