Momentum Weakens, Singtel Stock Gains 4.94% Today
On Agustus 18, 2026: price 4.46 SGD, trend sideways, RSI 53.3, support 4.25, resistance 4.61. technical analysis of singtel stock. Momentum Weakens — full…

Singapore Telecom (Singtel) on SGX rose to 4.46 SGD from 4.25, a move of 4.94% in one day, and the chart now shows a stock that has bounced, but not yet broken out decisively. The price is still trading inside a broader sideways pattern, with the market trying to decide whether this is a short-covering rebound or the start of a firmer trend.
Trend & Price Action
The most important signal is that Singtel is now sitting above SMA20 at 4.41 and above SMA50 at 4.39, which is a modestly constructive setup after recent weakness. In plain terms, the short-term price is back above both its near-term and medium-term average, so momentum has improved enough to challenge the prior drift lower, even though the broader trend is still described as sideways.
There is no fresh MA-cross, which matters because moving-average crossovers often mark a clearer change in regime. Here, the lack of a new cross suggests the recovery is still in the early validation stage rather than a confirmed trend reversal.
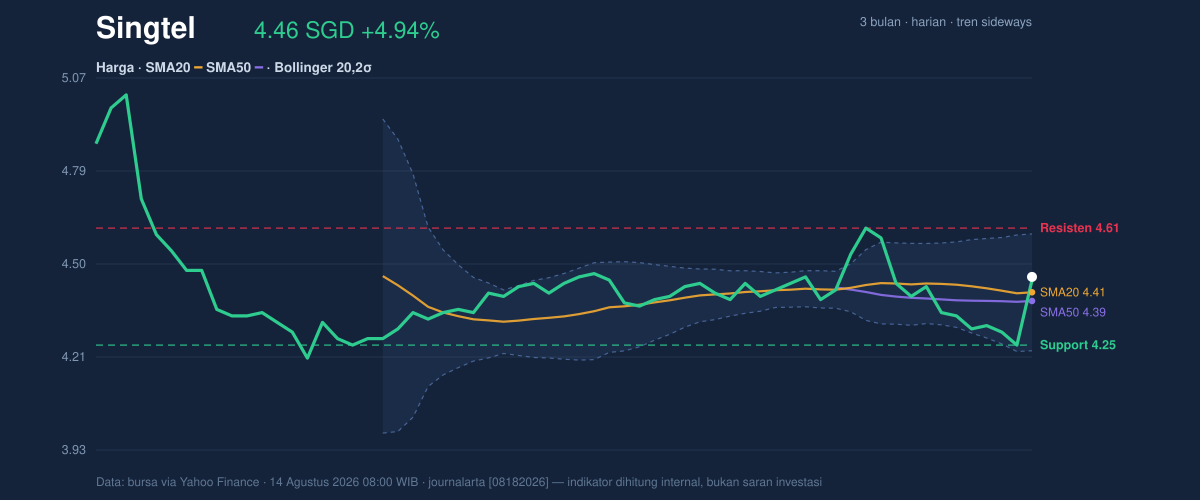
The Bollinger Band structure also helps explain the move. Price is near the middle of the band at 4.41, with the upper band at 4.59 and lower band at 4.23. That puts the stock at 58% of its 20-hour range, which is a neutral-to-firm position rather than an overheated one. The band width of 8.2% is normal, so the market is not signaling a squeeze or an explosive volatility setup yet.
The nearest reference points are clear: support at 4.25 and resistance at 4.61. The price is currently closer to the upper half of that range, which tells readers the rebound has already done some work, but it still needs follow-through to prove it can escape the recent band.
Oscillators & Momentum
Momentum is more mixed than the price action suggests. RSI at 53.3 is neutral, meaning the stock is neither stretched nor washed out. That is important because it implies the recent rise is not being driven by an overbought condition that would usually be vulnerable to a quick fade.
The stochastic oscillator is also neutral, with %K at 51.0 and %D at 24.5. This setup suggests the faster line has moved above the slower line, which can hint at improving short-term momentum, but the reading is still not strong enough to call it a full bullish impulse.
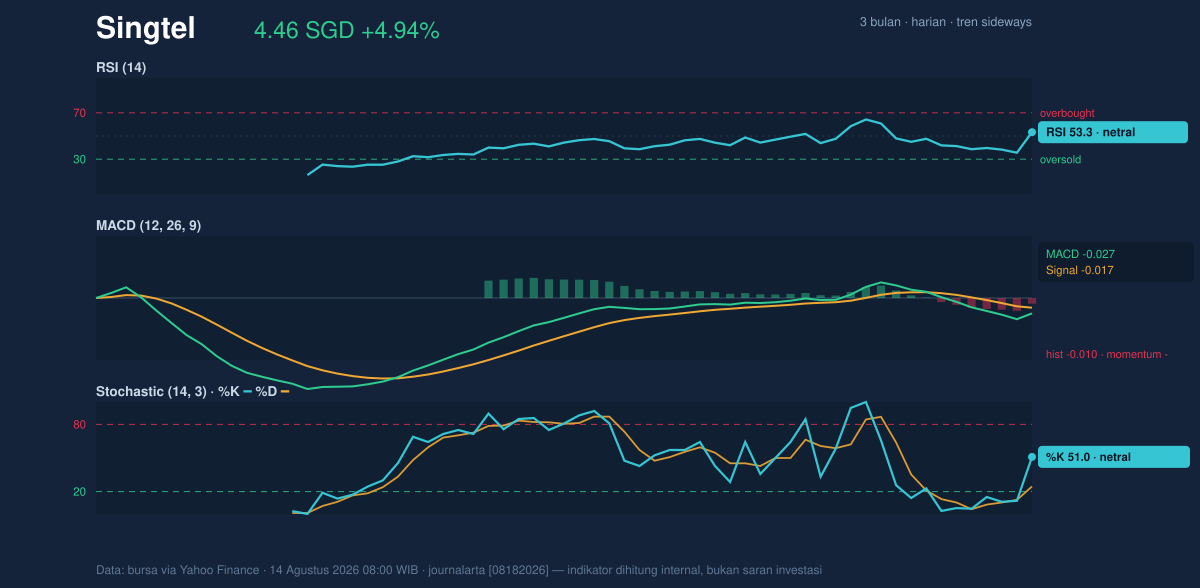
The caution flag comes from MACD. MACD at -0.027 remains below the signal line at -0.017, and the histogram at -0.010 is still negative. In practical terms, that means the underlying trend momentum has not fully turned positive yet, even if the price has bounced above its moving averages. This is a classic case of price improving before momentum confirms, which often happens near the middle of a range.
Volatility & Volume
Volatility is present, but not extreme. The ATR(14) of 0.11 equals 2.5% of price, which indicates moderate daily movement. That matters because it suggests the stock can still travel meaningfully in either direction, but it is not in a high-stress regime where wide gaps or disorderly swings dominate.
Volume is the strongest bullish participation signal in the data. Last volume was 56,866,700, about 1.6× the 20-hour average of 35,343,473. A jump like that usually means the market is paying attention, and a rebound backed by heavier trading is more credible than one built on thin turnover.
But the volume confirmation is not perfect. OBV is down, which means the longer-running flow of volume has not yet fully reversed in favor of accumulation. In simple language, more shares changed hands on the latest move, but the broader volume trend has not yet turned decisively supportive. That is why the rally still looks like a test rather than a verdict.
Key Levels & Scenarios
The chart shows the stock trading inside a well-defined band between 4.25 support and 4.61 resistance. A clean move through 4.61 would matter because it would take price above the recent ceiling and push it closer to the upper Bollinger band at 4.59, effectively showing that buyers can sustain control beyond the current rebound zone.
On the downside, a failure to hold 4.25 would be more serious than a small pullback around the current level. That would place price back toward the lower Bollinger band at 4.23 and reopen the path toward the 3-month low of 4.15, which is the clearest lower-bound reference in the data.
The broader range also frames the story. The 3-month high is 5.05, so the stock is still materially below the top of that range, and the present move should be read as a recovery inside a larger consolidation rather than a breakout from a long-term base.
Technical Verdict: HOLD (wait & see)
HOLD (wait & see) because the price has improved above both SMA20 at 4.41 and SMA50 at 4.39, but MACD remains negative and OBV is down, so trend confirmation is incomplete. The volume surge of 1.6× average is encouraging, yet the market still needs a cleaner push through resistance to prove the rebound is durable. The setup is constructive, but not decisive, while the broader trend remains sideways.
- Ideal Entry Range: 4.41 to 4.46, where the price sits near the moving averages and the middle Bollinger band.
- Exit Target: 4.59 to 4.61, aligned with the upper Bollinger band and 20-hour resistance.
- Stop Loss Protection: 4.25, the key support; a break below it weakens the rebound case.
- Verdict invalidated if price breaks below 4.25.
For non-traders, this means Singtel has recovered enough to merit attention, but not enough yet to prove the move is lasting.
The latest 3-month high is 5.05.
Summary Data Singtel
| Last price | 4.46 SGD |
| Change 1 day / 5 days / 1 month | 4.94% / 2.76% / 1.59% |
| Trend / MA-cross | sideways / none |
| SMA20 / SMA50 | 4.41 / 4.39 |
| RSI (14) / Stochastic %K | 53.3 / 51.0 |
| Bollinger %B / ATR | 63% / 0.11 |
| Support / Resistance 20 days | 4.25 / 4.61 |
| Data as of | 14 Agustus 2026 08:00 WIB |


