MRK Stock Analysis: Gains 0.31%, Testing Key Resistance
On Agustus 18, 2026: price 135.97 USD, trend uptrend, RSI 68.8, support 124.40, resistance 135.84. technical analysis of mrk stock. MRK Stock Analysis — full…

Merck is pressing against the top of its recent range, and that matters because the stock is now trading where momentum often decides whether a rally extends or pauses. On the New York Stock Exchange, Merck (MRK) last changed hands at 135.97 USD, up 0.31% on the day and 5.75% over 5 days, according to Yahoo Finance data for 14 August 2026 at 20:30 WIB. That places the shares at the 3-month high of 135.97, with price sitting above SMA20 at 129.97 and above SMA50 at 125.48, a simple but important sign that the intermediate trend remains constructive.
Trend & Price Action
The chart shows a stock that is still in an uptrend, and the slope of SMA20 at 1.65% over 5 days suggests the recent climb has been gaining traction rather than fading. In plain terms, the 20-day average is rising fast enough to confirm that buyers have been willing to pay progressively higher prices. The lack of a fresh MA-cross is also meaningful: there is no new moving-average crossover signaling a sudden regime shift, so the current move looks more like continuation than a brand-new breakout story.
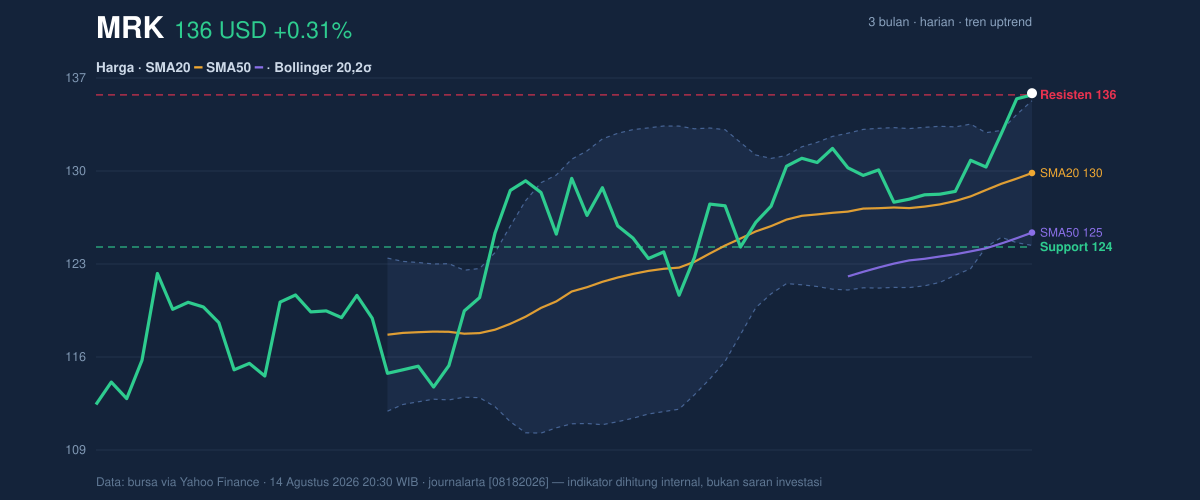
What stands out most is where the price sits inside the range. With the stock at 101% of the 20-hour range and just above resistance at 135.84, Merck is effectively testing the ceiling rather than moving comfortably through the middle of the band. That is often where the market reveals conviction. If price can stay above that level, the chart begins to look like a breakout attempt; if not, the move risks becoming an overextended push into resistance.
The candle is not far from the upper boundary of the Bollinger band at 135.41, which tells a similar story. Price is already trading beyond the band’s top, and that usually means strength is stretched rather than absent.
Oscillators & Momentum
Momentum indicators are mostly aligned with the trend, but they are also warning that the stock may be getting hot in the short term. The RSI at 68.8 is described here as neutral, but it is close enough to the conventional overbought zone to suggest enthusiasm is elevated. More striking is the Stochastic %K at 98.7 and %D at 91.1, which is clearly overbought. Stochastic measures where the latest close sits within its recent range, so readings near 100 mean the stock has been closing near the top of that range repeatedly. That often happens in strong trends, but it also leaves less room for immediate upside without a pause.
The MACD picture is the most supportive part of the momentum setup. With MACD at 2.284 above its signal line at 1.864, and a histogram of 0.420, the trend impulse remains positive. In practical terms, MACD is saying the recent rise still has internal force behind it, even if shorter-term oscillators are stretched.
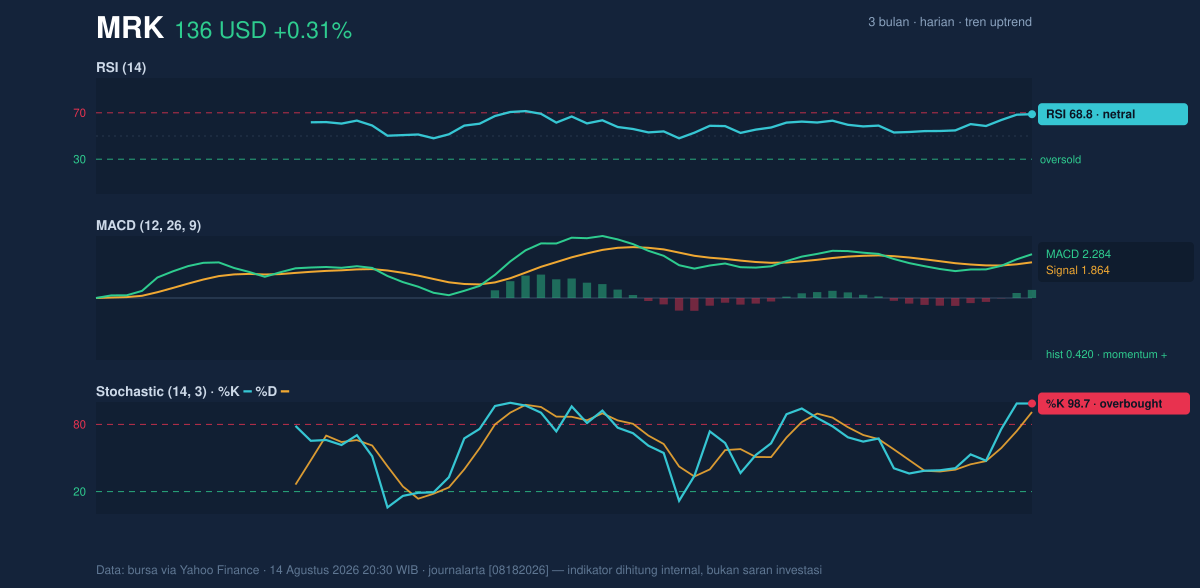
That combination matters: trend-following tools are still bullish, while fast oscillators are flashing caution. This is the kind of mix that often appears near resistance, where the market needs fresh volume to keep climbing.
Volatility & Volume
Volatility is moderate rather than explosive. The ATR(14) at 3.36, equal to 2.5% of price, suggests the stock is moving enough to matter but not with the kind of turbulence that usually accompanies panic or capitulation. Bollinger band width at 8.4% is described as normal, so this is not a squeeze setup where a large move is being compressed into a narrow coil. Instead, the market is already in motion, and the question is whether it can extend.
Volume tempers the enthusiasm. The latest volume of 6,869,000 was only 0.8x the 20-day average of 8,213,210. That means the push toward the highs has not yet been backed by unusually strong participation. On the other hand, OBV is rising, which is constructive because on-balance volume tracks whether money flow is accumulating over time. Rising OBV alongside a rising price often signals that buyers have been in control even if the latest session was not especially busy.
In short: the tape is supportive, but not emphatic.
Key Levels & Scenarios
The market’s immediate battleground is clear. Resistance sits at 135.84, almost exactly where the stock is now, while support is 124.40. With the price already at the top of the recent range, the next move depends less on trend direction and more on whether Merck can hold above the upper boundary after the recent run.
If the shares remain above 135.84, the chart would confirm that the market is accepting new highs rather than rejecting them. If it slips back below that zone, the recent advance may simply be a momentum test rather than a lasting breakout. A move toward 124.40 would signal a deeper retracement into the prior support area and would weaken the case that the current uptrend is fully intact.
The key signal is not just that Merck is strong — it is that the stock is now strong at a level where strength must prove itself.
Technical Verdict: HOLD (wait & see)
HOLD (wait & see)
- MACD remains positive, so the broader trend impulse is still constructive.
- Price is above SMA20 and SMA50, confirming the uptrend is intact.
- Stochastic is overbought and price is pressing against 135.84 resistance, so short-term extension risk is elevated.
- Verdict invalidated if price falls below 124.40, which would break the nearest support and weaken the current trend structure.
- Ideal Entry Range: 129.97 to 135.84
- Exit Target: 135.97
- Stop Loss protection: 124.40
For non-traders: Merck still looks technically healthy, but the stock is close enough to resistance that the next move needs confirmation rather than assumption.
Summary Data MRK
| Last price | 135.97 USD |
| Change 1 day / 5 days / 1 month | 0.31% / 5.75% / 6.64% |
| Trend / MA-cross | uptrend / none |
| SMA20 / SMA50 | 129.97 / 125.48 |
| RSI (14) / Stochastic %K | 68.8 / 98.7 |
| Bollinger %B / ATR | 105% / 3.36 |
| Support / Resistance 20 days | 124.40 / 135.84 |
| Data as of | 14 Agustus 2026 20:30 WIB |


