OCBC Stock Analysis: Gains 0.16%, RSI Overbought
On Agustus 18, 2026: price 31.55 SGD, trend uptrend, RSI 77.8, support 28.56, resistance 31.79. technical analysis of ocbc stock. OCBC Stock Analysis — full…

OCBC Bank’s shares edged up to 31.55 SGD on SGX, just above the previous close of 31.50, but the more important message from the tape is that the stock is now pressing against the upper edge of its recent range. As shown in the chart, that kind of action usually means momentum is still in charge, yet the market is also beginning to test how much of the move has already been priced in.
Trend & Price Action
The broader setup remains constructive. OCBC is trading above both its SMA20 at 29.55 and SMA50 at 27.00, and the uptrend is being reinforced by the SMA20’s 2.82%/5-day slope. That matters because a rising short-term average often signals persistent buying rather than a one-off spike. The lack of a fresh MA-cross is also telling: this is not a new trend ignition, but a continuation phase, which tends to be less dramatic and more dependent on follow-through.
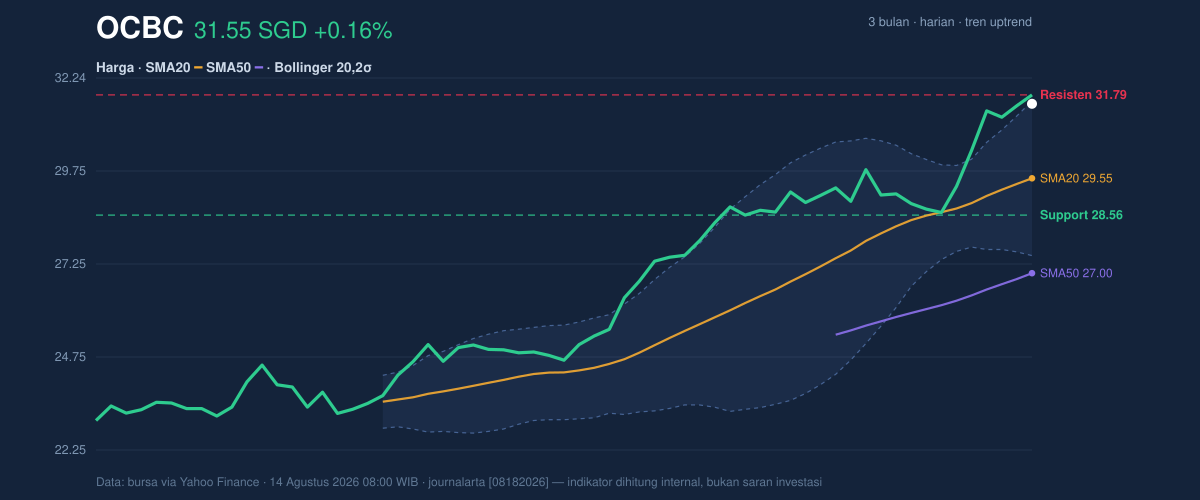
Price is now sitting near the top of the visible band. The stock is at 93% of its 20-hour range, with support at 28.56 and resistance at 31.79. It is also only a fraction below the 3-month high of 31.86, which makes the current zone important: a move through resistance would confirm that buyers are still willing to pay up for the shares, while failure there would suggest the rally is tiring near a known ceiling.
The Bollinger framework says the same thing in different language. With the upper band at 31.63 and price trading just below it, OCBC is hugging the top of its recent volatility envelope. The %B at 98% means the stock is almost fully stretched toward the upper band, a classic sign of strength, but also a warning that near-term upside may become harder to extend without a pause. The 14.1% band width is still normal, so this is not a volatility breakout regime; it is a steady trend being pushed near its upper boundary.
Oscillators & Momentum
The momentum indicators are strong, but they are also flashing the usual late-stage caution. RSI at 77.8 and Stochastic %K 97.9 / %D 94.6 both sit in overbought territory, which does not automatically mean reversal, but it does mean the stock is technically extended. In plain terms, recent buyers have been active enough that the next leg higher may need fresh news, stronger volume, or a clean break above resistance to keep going.
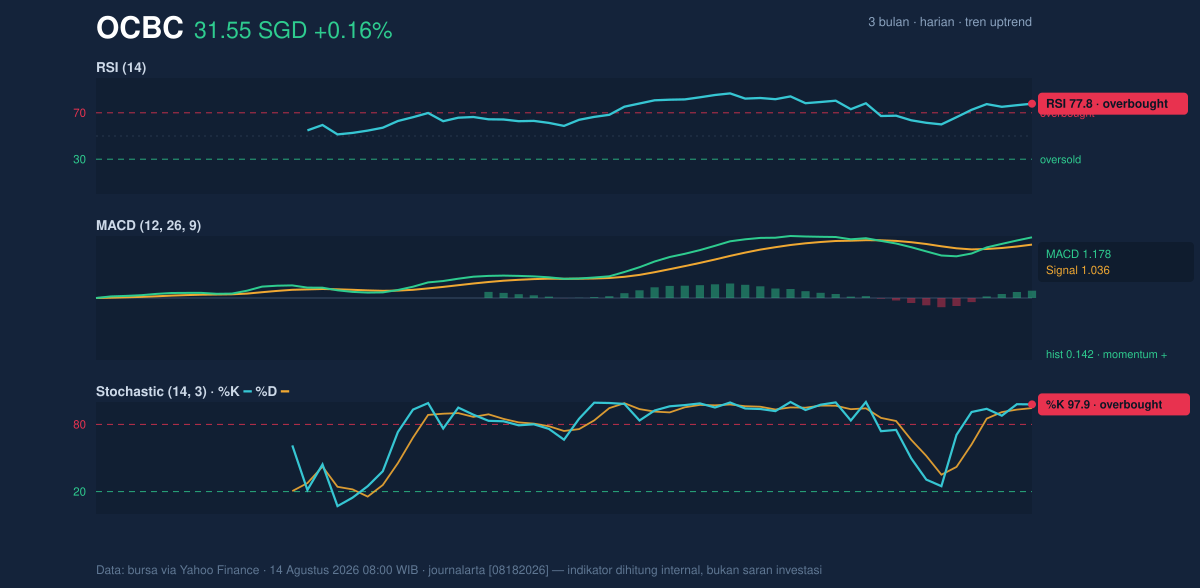
The MACD at 1.178, above its signal line at 1.036 with a 0.142 histogram, still supports the trend. MACD is a trend-following indicator, so a positive reading tells us the underlying move remains intact even as the oscillators warn of overextension. That alignment is important: momentum is positive, but it is no longer early-cycle momentum. It is more mature, and mature trends can keep climbing, though often with sharper pauses along the way.
Volatility & Volume
Volatility is moderate rather than explosive. The ATR of 0.66, equal to 2.1% of price, suggests the stock can still move meaningfully in a session, but not in a disorderly way. That gives the current setup a controlled feel: not a low-energy drift, but not a panic-prone chart either.
Volume does not yet confirm a breakout. The latest turnover of 7,230,946 was almost exactly in line with the 20-session average of 7,232,389, or 1.0× normal. That matters because when a stock is challenging the top of its range, stronger-than-average volume often helps validate the move. Here, participation is adequate, but not emphatic. The rising OBV still points to accumulation over time, which is a positive sign, yet the lack of a volume surge means traders have not fully committed to a decisive push through resistance.
Key Levels & Scenarios
The market is now focused on a narrow decision zone. Resistance at 31.79 is the immediate hurdle, and the nearby 3-month high of 31.86 is the next reference if that barrier gives way. On the downside, support at 28.56 is the first level that would matter if momentum cools. The SMA20 at 29.55 sits between those points and can act as a dynamic support zone if price slips but the trend remains intact.
If OCBC clears 31.79 with improving volume, the chart would be signaling continuation rather than exhaustion. If it fails to hold above the upper band and slips back through 29.55, the message changes: the rally would look stretched and vulnerable to a retracement toward 28.56. The key distinction is whether the stock can convert overbought strength into a clean breakout, or whether it simply remains pinned near the top of its recent range.
Technical Verdict: HOLD (wait & see)
HOLD (wait & see)
- RSI at 77.8 and Stochastic %K 97.9 / %D 94.6 show the stock is overbought, which raises the risk of near-term fatigue.
- MACD at 1.178 above signal 1.036 keeps the trend positive, so the chart is not damaged even though it is extended.
- Price is sitting just below resistance at 31.79 and near the upper Bollinger band at 31.63, which means the next move matters more than the current one.
- Invalidation condition: this verdict is invalidated if price falls below 29.55.
- Ideal entry range: 29.55 to 28.56
- Exit target: 31.79 to 31.86
- Stop loss protection: below 28.56
In plain English, the stock still looks strong, but it is close enough to resistance that the chart is asking for confirmation rather than enthusiasm.
Summary Data OCBC
| Last price | 31.55 SGD |
| Change 1 day / 5 days / 1 month | 0.16% / 7.57% / 9.62% |
| Trend / MA-cross | uptrend / none |
| SMA20 / SMA50 | 29.55 / 27.00 |
| RSI (14) / Stochastic %K | 77.8 / 97.9 |
| Bollinger %B / ATR | 98% / 0.66 |
| Support / Resistance 20 days | 28.56 / 31.79 |
| Data as of | 14 Agustus 2026 08:00 WIB |


