PDD Stock Gains 3.29%, Momentum Weakens In Focus
On Agustus 18, 2026: price 86.94 USD, trend sideways, RSI 43.8, support 82.66, resistance 93.00. technical analysis of pdd stock. PDD Stock Gains — full…

PDD Holdings is trading in a narrow technical middle ground: the stock rose 3.29% on the day to 86.94 USD, but the broader setup still looks cautious because price remains below the 20-day average and momentum has not fully turned. For international readers, that means the market is rewarding short-term resilience without yet showing the kind of follow-through that usually marks a cleaner trend change.
Trend & Price Action
The chart shows a stock that is trying to stabilize rather than break out. PDD is sitting at 86.94 USD, just under SMA20 at 87.58 and above SMA50 at 84.03, which places it between short-term resistance and longer-term support. That position matters: when price is below the 20-day average but still above the 50-day line, it often signals a market that has not chosen a direction yet, with traders testing whether recent weakness is temporary or the start of a deeper fade.
The trend is labeled sideways, and the SMA20 slope of 0.95% over 5 days suggests only a mild upward tilt, not a decisive trend acceleration. There is no fresh MA-cross, so the moving averages are not delivering a clean bullish or bearish signal. In practical terms, the chart is waiting for a catalyst: either a push back above the short-term average to restore confidence, or a slip toward the lower band and support zone to show sellers still control the tape.
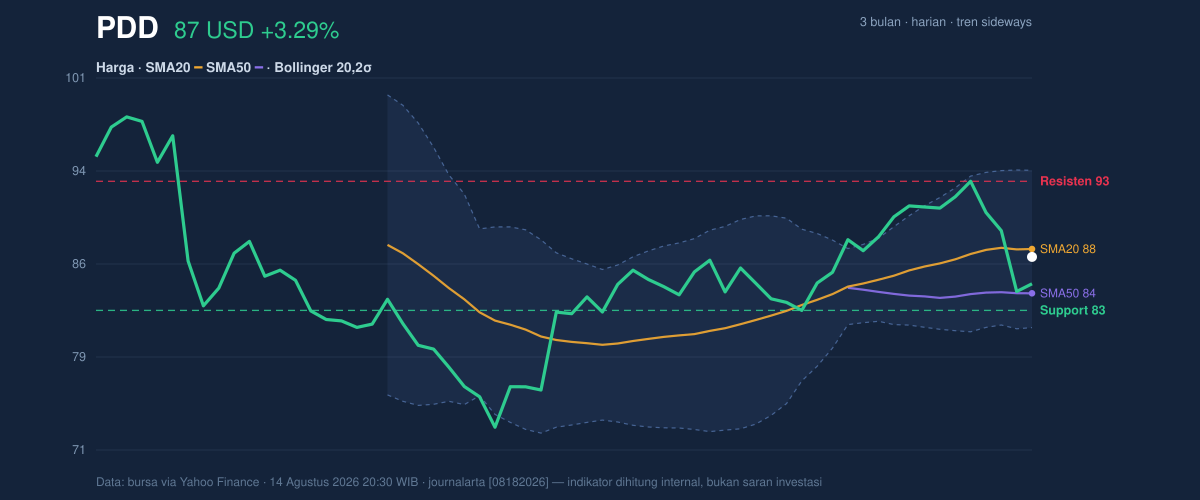
The stock is also trading in the lower half of its recent range, with price at 41% of the 20-hour range and the 3-month span stretching from 71.94 to 98.40. That keeps the recent move in context. The rebound from the day’s close is real, but it is not yet large enough to erase the message from the range: PDD is still operating inside a broad consolidation, not in a confirmed breakout phase.
Oscillators & Momentum
The momentum picture is mixed, and that mix is the key signal. The RSI at 43.8 is neutral, which means the stock is neither stretched on the upside nor deeply washed out. That alone would suggest balance. But the Stochastic %K at 11.9 and %D at 28.0 show a more oversold condition, implying the stock has already been sold hard enough in the short term that a bounce is possible. Oversold does not mean cheap in a fundamental sense; it means the recent pace of selling may be slowing.
The more important caution comes from the trend-confirmation tools. The MACD at 0.939 sits below its signal line at 1.485, and the -0.546 histogram says downside momentum still outweighs upside momentum. In plain English, the stock may be stabilizing, but the internal rhythm of price has not yet turned fully positive. This is why the chart can look tired even after a positive daily move: momentum indicators often lag the headline bounce and reveal whether buyers are actually taking control.
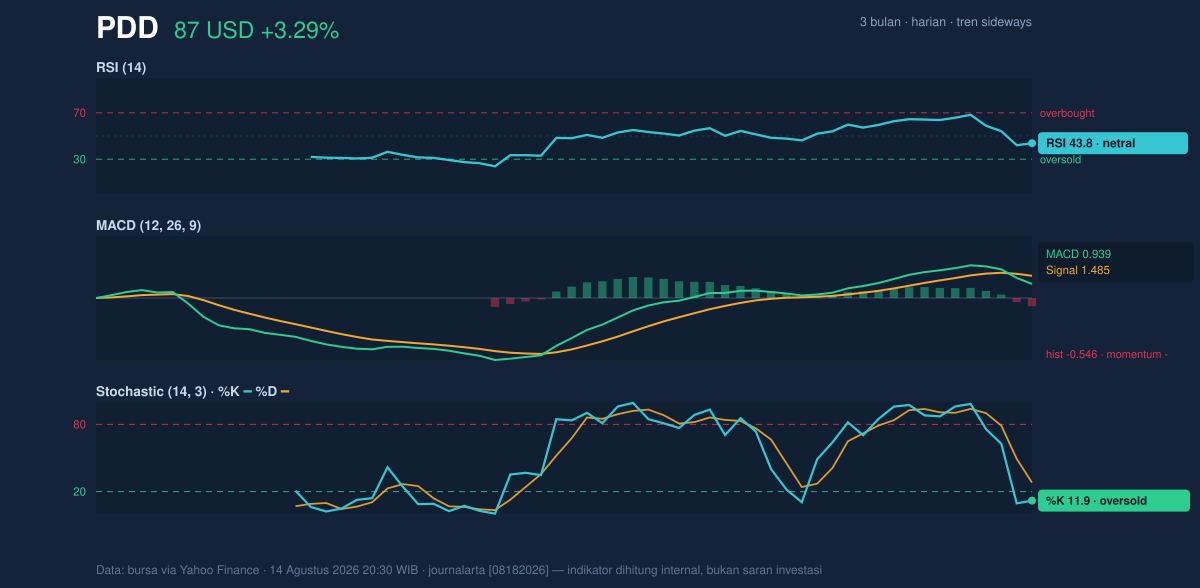
So the oscillator setup is not bearish in an extreme sense, but it is not fully constructive either. RSI is neutral, Stochastic is oversold, and MACD remains negative—a combination that often appears when a stock is near a short-term turning point, but before confirmation arrives. That is a useful distinction for readers: oversold conditions can support a bounce, yet negative MACD warns that any rebound still needs proof.
Volatility & Volume
Volatility is moderate rather than explosive. The ATR at 2.35, or 2.7% of price, suggests the stock can move enough to create meaningful swings, but not so violently that the chart is in panic mode. The Bollinger Bands reinforce that idea: the upper band is 93.87, the middle band is 87.58, and the lower band is 81.28, with %B at 45% and a 14.4% band width. That width is described as normal, which usually means the stock is not in a squeeze that would hint at an imminent volatility breakout.
The placement inside the bands is also telling. At 45% %B, price is below the midpoint but not pressed against the lower band, so the market is neither euphoric nor distressed. This is a classic “wait for confirmation” structure. If price can reclaim the middle band and hold it, sentiment could improve quickly. If it fails and rolls over, the lower band and support area become more relevant.
Volume does not yet confirm the rebound. Last volume was 4,733,100 versus a 20-day average of 5,617,065, or 0.8x normal. That means the day’s gain came on lighter participation, which weakens the signal. The OBV is falling, and that matters because on-balance volume tracks whether money flow is accumulating or leaving the stock. A falling OBV alongside a price bounce often suggests that rallies are not yet being broadly supported.
Key Levels & Scenarios
The most important nearby levels are clear on the chart. Support at 82.66 is the first line that matters, while resistance at 93.00 marks the ceiling traders are likely watching. Those levels frame the current setup better than the day’s gain does. If price holds above 82.66 and can recover SMA20 at 87.58, the path toward 93.00 becomes more credible. If it fails to hold 82.66, the market would be signaling that the rebound is losing traction and that the lower Bollinger band at 81.28 is the next technical reference.
The broader range also gives context. With the 3-month high at 98.40 and low at 71.94, PDD is still well inside a wide corridor, which is another way of saying the stock has room to move in either direction without leaving its larger range. The current position does not yet look like a decisive trend reversal; it looks like a contested zone where buyers and sellers are still testing each other.
Technical Verdict: HOLD (wait & see)
HOLD (wait & see) is the clearest technical reading because the stock has short-term oversold support, but the trend and momentum confirmation are not yet aligned.
- Strongest reasons:
- Stochastic is oversold at 11.9 / 28.0, which can support a rebound.
- Price is above SMA50 at 84.03, so the longer short-term structure is not broken.
- MACD remains below the signal line and the histogram is negative, which argues against assuming a full recovery too early.
- Verdict invalidated if price breaks below 82.66, because that would weaken the current support base and expose the lower Bollinger band at 81.28.
- Ideal Entry Range: 82.66 to 87.58
- Exit Target: 93.00
- Stop Loss protection: below 81.28
For non-traders, this means the stock is not giving a clean “go” signal yet, but it is also not showing a decisive breakdown. The next move will be told by whether it can hold 82.66 and reclaim 87.58.
“Until the volume comes back, this looks more like a pause than a promise.”
Summary Data PDD
| Last price | 86.94 USD |
| Change 1 day / 5 days / 1 month | 3.29% / -5.25% / 3.33% |
| Trend / MA-cross | sideways / none |
| SMA20 / SMA50 | 87.58 / 84.03 |
| RSI (14) / Stochastic %K | 43.8 / 11.9 |
| Bollinger %B / ATR | 45% / 2.35 |
| Support / Resistance 20 days | 82.66 / 93.00 |
| Data as of | 14 Agustus 2026 20:30 WIB |


