T Stock Technicals Today: Gains 0.41%, Testing Key Resistance
On Agustus 18, 2026: price 24.68 USD, trend uptrend, RSI 65.7, support 21.95, resistance 24.89. technical analysis of t stock. Stock Technicals — full details…

AT&T shares finished at 24.68 USD, up 0.41% on the day and 13.16% over the past month, with the stock now sitting close to the top of its recent trading range. The move matters because it is happening above both the SMA20 at 23.68 and the SMA50 at 22.68, which tells the market that the latest rebound is no longer just a short bounce; it is trading with a firmer upward structure, even if momentum is starting to look stretched.
Trend & Price Action
The chart shows AT&T in a clear short-term uptrend, with the SMA20 rising at 3.10% over 5 days. That slope is important: a rising moving average means recent prices have been consistently higher, so the average itself is pulling upward rather than acting as a ceiling. In plain terms, the stock has been building a better floor beneath it.
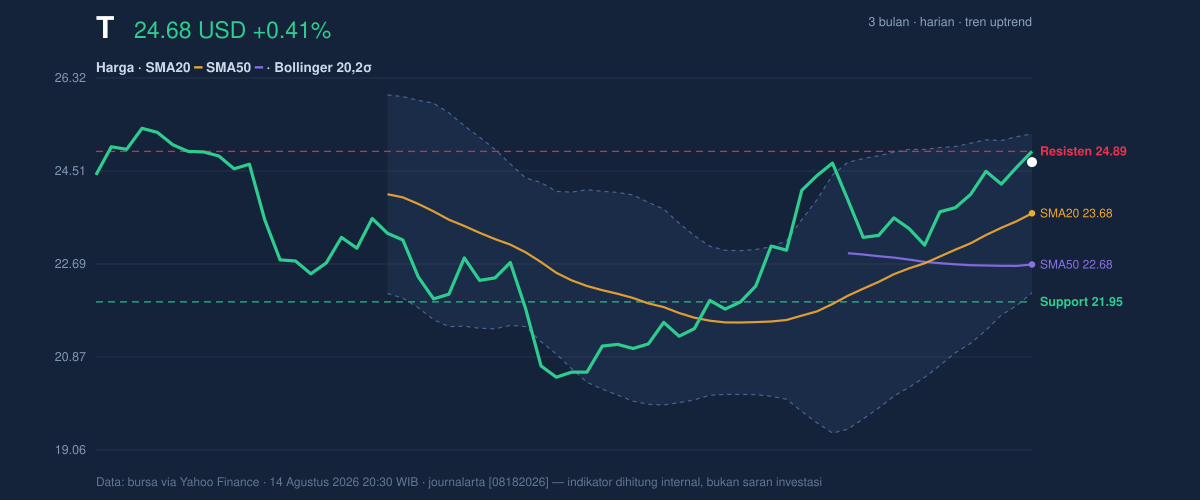
The last price is also very close to the 20-hour resistance at 24.89 and sits at about 93% of the range, which signals that traders have already pushed it near the upper edge of the current band. The stock is still below the 3-month high of 25.43, so there is room to extend the move, but it is now entering a zone where follow-through matters more than the initial rebound. If the price can clear the nearby resistance, it would confirm that demand is still strong; if it fails there, the market may treat the move as a pause rather than a breakout.
Oscillators & Momentum
The momentum picture is mixed, and that is the key signal here. The RSI at 65.7 is still labeled neutral, but it is approaching the upper end of the range where rallies often begin to lose steam. More telling is the Stochastic %K at 84.5 versus %D at 73.0: that is an overbought reading, meaning the stock has risen fast enough that short-term traders may already be crowded on the same side of the trade. Overbought does not mean the stock must fall; it means the pace of gains is more vulnerable to a breather.
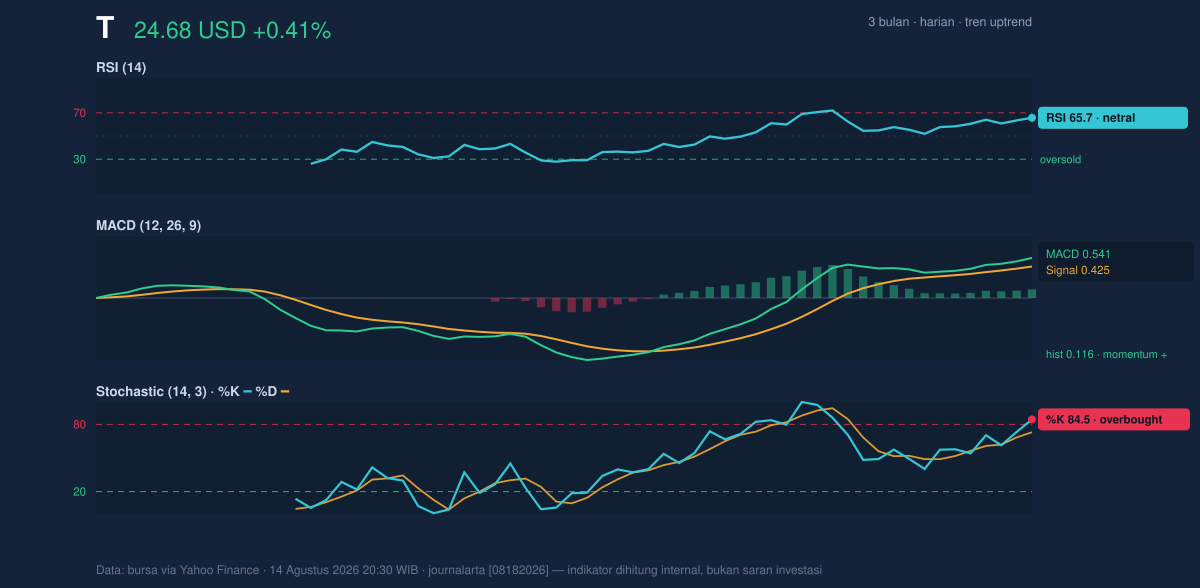
Against that, the MACD at 0.541 remains above the signal line at 0.425, with a positive histogram of 0.116. MACD is a trend-following measure, so this alignment says upward momentum is still in place. In practical terms, the trend has not broken; it is simply getting more mature. The combination of an overbought Stochastic and positive MACD usually points to a market that can continue higher, but only if buyers keep showing up quickly enough to absorb profit-taking.
Volatility & Volume
Volatility is not flashing alarm bells. The Bollinger Bands are relatively normal, with a 13.1% width, and the price is near the upper band at %B 82%. That placement means AT&T is trading closer to the top of its recent statistical range than the middle, which often reflects strength but also reduces the margin for error. The ATR at 0.63, or 2.5% of price, suggests movement is moderate rather than explosive, so any push through resistance may still happen in a measured way instead of a sharp gap.
Volume, however, is the softer spot in the setup. The latest volume of 27,109,300 is only 0.4x the 20-session average of 67,394,035, which means the advance is happening with lighter participation than usual. That matters because price gains built on thin turnover can be less durable; they may reflect fewer sellers than a true wave of new buyers. The one constructive counterweight is that OBV is rising, which indicates the broader accumulation trend is still improving even if the latest session was quiet.
Key Levels & Scenarios
The immediate map is fairly clear. On the downside, the first important floor is the 20-hour support at 21.95. That level is well below the current price, but it is the nearest named support in the data and would likely be watched if sentiment deteriorates. More relevant in the near term is the SMA20 at 23.68, which now acts as dynamic support because the stock is trading above it. A hold above that line would keep the short-term trend intact.
On the upside, the first hurdle is the 24.89 resistance. A clean move through that area would place the 3-month high at 25.43 back in focus. Because the stock is already near the top of its range, the market is effectively asking whether this is the start of a new leg higher or just a test of overhead supply. The answer will likely depend on whether price can stay above the moving averages while momentum remains constructive.
Technical Verdict: HOLD (wait & see)
HOLD (wait & see)
- MACD remains positive, showing the broader trend is still constructive.
- Price is above SMA20 and SMA50, which keeps the structure bullish.
- Stochastic is overbought and price is near resistance, so upside may need a pause before extending further.
Verdict invalidated if price falls below 23.68 and loses the SMA20, because that would weaken the short-term trend structure.
- Ideal Entry Range: 23.68 to 24.89
- Exit Target: 25.23 to 25.43
- Stop Loss protection: below 22.13, with the deeper support at 21.95 as the next reference
For non-traders, this means the stock still looks healthy, but it is already close to a zone where buyers need to prove they can keep pushing.
“Momentum is still there, but the next move will need conviction, not just drift.”
Summary Data T
| Last price | 24.68 USD |
| Change 1 day / 5 days / 1 month | 0.41% / 3.74% / 13.16% |
| Trend / MA-cross | uptrend / none |
| SMA20 / SMA50 | 23.68 / 22.68 |
| RSI (14) / Stochastic %K | 65.7 / 84.5 |
| Bollinger %B / ATR | 82% / 0.63 |
| Support / Resistance 20 days | 21.95 / 24.89 |
| Data as of | 14 Agustus 2026 20:30 WIB |


