Tencent Stock Gains 1.22% Today, Momentum Weakens
On Agustus 18, 2026: price 446.40 HKD, trend sideways, RSI 40.5, support 434.60, resistance 492.20. technical analysis of tencent stock.

Tencent Holdings slipped in Hong Kong trading on 14 August 2026, with 0700.HK last changing hands at HKD 446.40, up 1.22% on the day but still sitting below its short- and medium-term trend markers, according to data from the exchange via Yahoo Finance. The move matters less as a one-day bounce and more as a test of whether the stock can stabilise after a -6.77% five-day slide and a -3.29% decline over the past month. In plain terms, the chart is not showing a clean recovery yet; it is showing a stock trying to stop falling while still trading under the lines that usually define momentum.
Trend & Price Action
As shown in the chart, Tencent remains in a sideways trend, but the slope of SMA20 is -0.41% over five days, which signals that the short-term drift is still pointing down. The stock is trading below SMA20 at HKD 464.94 and also below SMA50 at HKD 455.32, so the price is not yet reclaiming the levels that often separate a pause from a stronger rebound. There is no fresh MA-cross, meaning the moving averages have not delivered a new bullish or bearish signal; instead, they are telling a quieter story of hesitation.
That matters because Tencent is now positioned near the lower half of its recent range. The 20-day support at HKD 434.60 sits just below the current price, while 20-day resistance at HKD 492.20 is far enough above to act as a real ceiling unless buyers return with conviction. The stock is also trading in the lower part of the 3-month range of HKD 411.00 to HKD 497.80, which suggests the market is still pricing caution rather than confidence.
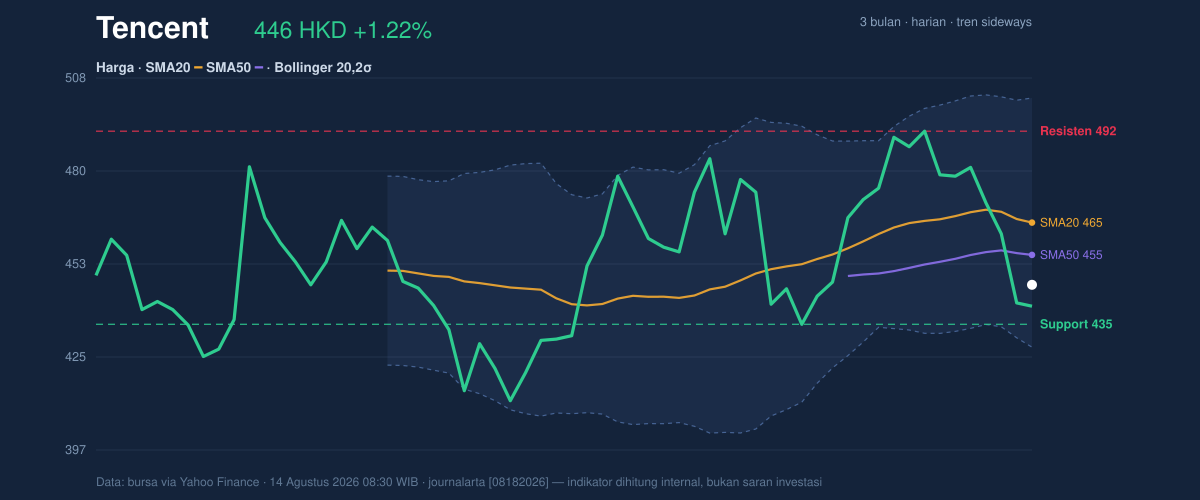
A modest rebound is not the same as a trend reversal.
Oscillators & Momentum
The momentum picture is mixed, and that is the key signal. RSI at 40.5 sits in neutral territory, which means Tencent is neither stretched to the upside nor washed out enough to call a strong oversold reversal on its own. By contrast, Stochastic %K at 6.5 and %D at 20.1 are deep in oversold territory, showing that the stock has been under sustained selling pressure and is now technically compressed. In practical terms, Stochastic is warning that downside may be getting tired, but it is not a timing signal by itself.
The more important caution comes from MACD at 0.649 versus signal at 5.005, with a histogram of -4.355. That gap shows momentum is still negative: the faster line is below the signal line, which usually means rallies are being treated as pauses inside a broader weak patch rather than the start of a new uptrend. So while the oscillator mix hints at potential stabilisation, the MACD says the market has not yet confirmed a durable turn.
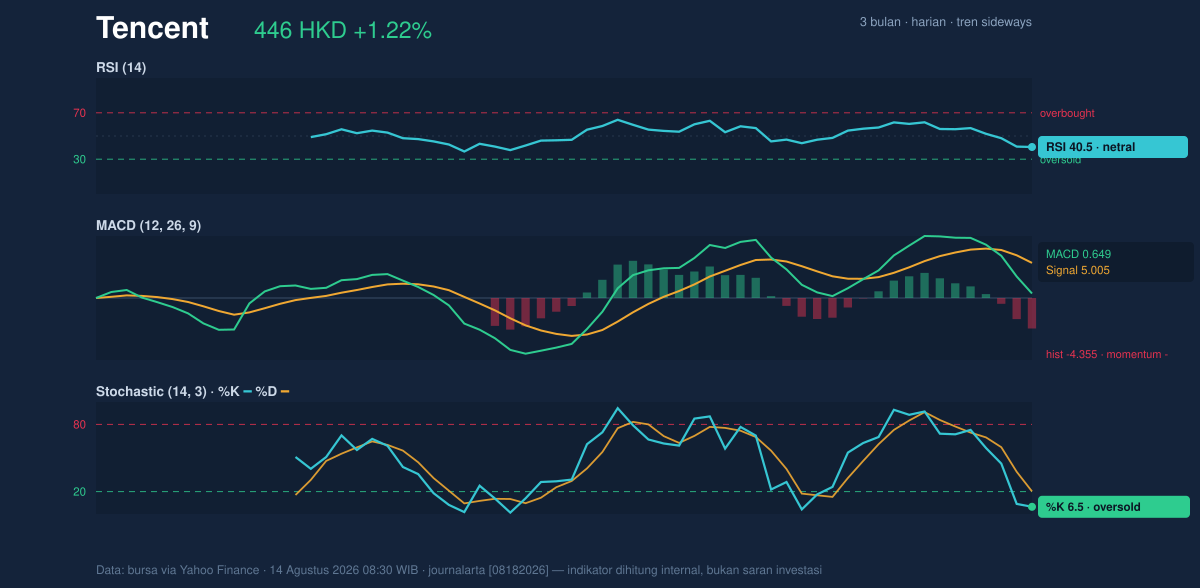
The stock looks oversold in parts, but not healed.
Volatility & Volume
Tencent’s volatility is not extreme, but it is enough to keep prices moving. ATR(14) at 14.00, or 3.1% of price, points to moderate daily swings rather than a quiet, low-risk tape. The Bollinger Bands add another layer: price is near the lower side of the band structure, with %B at 25%, while the band width is 16.0%, described as normal. That combination means the stock is not in a volatility squeeze that would usually precede a sharp breakout; instead, it is drifting inside a standard range with room to move either way.
Volume does not yet give a strong confirmation signal. Last volume was 30,601,060, only about 1.0× normal versus the 20-session average of 29,154,370. In other words, the day’s lift came without a major surge in participation. More telling is that OBV is falling, which suggests that, over time, trading pressure has been heavier on the distribution side than on the accumulation side. That is a subtle but important warning: a price bounce without improving volume leadership can fade quickly.
The market is still waiting for proof.
Key Levels & Scenarios
The nearest technical map is straightforward. HKD 434.60 is the first line of support, and it sits close enough to the current price that it will likely decide whether the recent bounce has any staying power. If that level holds, Tencent can try to rotate back toward SMA50 at HKD 455.32 and then SMA20 at HKD 464.94. Beyond that, the key hurdle is HKD 492.20 resistance, which also sits below the 3-month high of HKD 497.80. A move through that area would matter because it would put price back near the top of the recent range and force the market to reassess the downtrend bias.
If HKD 434.60 fails, the chart opens back toward the lower end of the 3-month range at HKD 411.00. That would reinforce the idea that the current bounce is only corrective. If, instead, Tencent can climb back above SMA50 and hold it, the tone would shift from defensive to repair mode.
Technical Verdict: HOLD (wait & see)
HOLD (wait & see)
- Price remains below SMA20 and SMA50, so the trend has not yet flipped back in favour of buyers.
- Stochastic is oversold, but MACD is still negative, which means the rebound case is early and unconfirmed.
- OBV is falling while volume is only normal, so the latest move lacks strong participation.
Verdict invalidated if price falls below HKD 434.60.
- Ideal Entry Range: HKD 434.60 to 446.40
- Exit Target: HKD 455.32 to 464.94
- Stop Loss protection: below HKD 434.60, with deeper downside risk if HKD 411.00 gives way
For non-traders: Tencent is trying to stop weakening, but the chart still needs to prove the rebound is real.
“The market has not yet forgiven the downtrend; it is only giving Tencent a chance to earn back trust.”
Summary Data Tencent
| Last price | 446.40 HKD |
| Change 1 day / 5 days / 1 month | 1.22% / -6.77% / -3.29% |
| Trend / MA-cross | sideways / none |
| SMA20 / SMA50 | 464.94 / 455.32 |
| RSI (14) / Stochastic %K | 40.5 / 6.5 |
| Bollinger %B / ATR | 25% / 14.00 |
| Support / Resistance 20 days | 434.60 / 492.20 |
| Data as of | 14 Agustus 2026 08:30 WIB |


